统计学习方法-感知机-原始形式与对偶形式-python代码实现
感知机
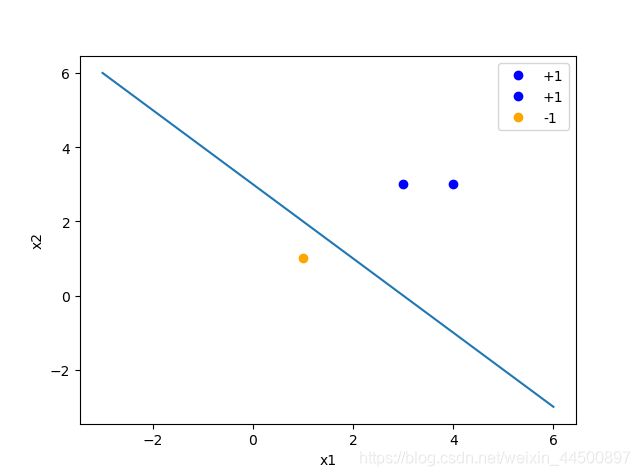
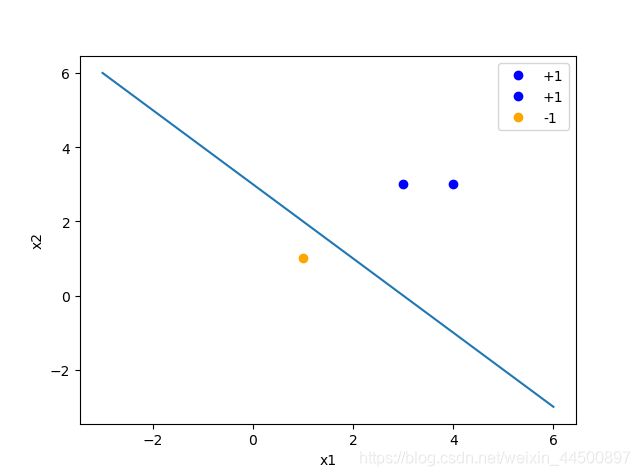
取书本上的正例点(3,3),(4,3),负例点(1,1)
以下是感知机的python代码实现:
原始形式代码:
import numpy as np
import matplotlib.pyplot as plt


data = np.array([[3, 3, 1], [4, 3, 1], [1, 1, -1]])
X = data[:, :2]
y = data[:, -1]


class Perceptron:
    def __init__(self):
        self.w = np.zeros(len(data[0])-1, dtype=np.float32)
        self.b = 0
        self.l_rate = 1  # 学习率

    def sign(self, x, w, b):
        y = np.dot(w, x)+b
        if y >= 0:
            return 1
        else:
            return -1

    def sgd(self, X_train, y_train):
        flag = False
        while not flag:
            wrong_count = 0
            for i in range(len(X_train)):
                X = X_train[i]
                y = y_train[i]
                if y*self.sign(X, self.w, self.b) <= 0:
                    self.w = self.w+self.l_rate*y*X
                    self.b = self.b+self.l_rate*y
                    print("误分类点:{} w:{}  b:{}".format(X, self.w, self.b,))
                    wrong_count += 1
            if wrong_count == 0:
                flag = True


def main():
    perceptron = Perceptron()
    perceptron.sgd(X, y)
    x_points = np.linspace(-3, 6, 10)
    y_points = -(perceptron.w[0]*x_points+perceptron.b)/perceptron.w[1]
    plt.plot(x_points, y_points)
    for i in range(len(data)):
        if data[i, 2] == 1:
            plt.plot(data[i, 0], data[i, 1], 'bo', color='blue', label='+1')
        elif data[i, 2] == -1:
            plt.plot(data[i, 0], data[i, 1], 'bo', color='orange', label='-1')
    plt.xlabel('x1')
    plt.ylabel('x2')
    plt.legend()
    plt.show()


if __name__ == '__main__':
    main()
误分类点:[1 1] w:[-1. -1.]  b:-1
误分类点:[3 3] w:[2. 2.]  b:0
误分类点:[1 1] w:[1. 1.]  b:-1
误分类点:[1 1] w:[0. 0.]  b:-2
误分类点:[3 3] w:[3. 3.]  b:-1
误分类点:[1 1] w:[2. 2.]  b:-2
误分类点:[1 1] w:[1. 1.]  b:-3
## 对偶形式
import numpy as np
import matplotlib.pyplot as plt


data = np.array([[3, 3, 1], [4, 3, 1], [1, 1, -1]])
X = data[:, :2]
Y = data[:, -1]


class PerceptronDaul:
    def __init__(self):
        self.alpha =np.zeros(len(data),dtype=np.float32)
        self.b =0
        self.l_rate = 1  # 学习率
        self.w=0

    def sign(self, X,Y,x,y,alpha, b, l_rate):
        result =np.sum(alpha*Y*np.dot(X,x))+b
        if result >= 0:
            return 1
        else:
            return -1

    def sgd(self, X, Y):
        flag = False
        while not flag:
            wrong_count = 0
            for i in range(len(X)):
                x = X[i]
                y = Y[i]
                if y*self.sign(X, Y,x,y,self.alpha, self.b,self.l_rate) <= 0:
                    self.alpha[i]=self.alpha[i]+self.l_rate
                    self.b = self.b+self.l_rate*y
                    self.w=np.dot(self.alpha*Y,X)#主要是每一步计算后显示W ,可以在最后计算
                    print("误分类点:{} a[{}]:{} w{}  b:{}".format(x, i,self.alpha[i], self.w,self.b))
                    wrong_count += 1
            if wrong_count == 0:
                flag = True
        self.w=np.dot(self.alpha*Y,X)


def main():
    perceptron = PerceptronDaul()
    perceptron.sgd(X, Y)
    x_points = np.linspace(-3, 6, 10)
    y_points = -(perceptron.w[0]*x_points+perceptron.b)/perceptron.w[1]
    plt.plot(x_points, y_points)
    for i in range(len(data)):
        if data[i, 2] == 1:
            plt.plot(data[i, 0], data[i, 1], 'bo', color='blue', label='+1')
        elif data[i, 2] == -1:
            plt.plot(data[i, 0], data[i, 1], 'bo', color='orange', label='-1')
    plt.xlabel('x1')
    plt.ylabel('x2')
    plt.legend()
    plt.show()


if __name__ == '__main__':
    main()
误分类点:[1 1] a[2]:1.0 w[-1. -1.]  b:-1
误分类点:[3 3] a[0]:1.0 w[2. 2.]  b:0
误分类点:[1 1] a[2]:2.0 w[1. 1.]  b:-1
误分类点:[1 1] a[2]:3.0 w[0. 0.]  b:-2
误分类点:[3 3] a[0]:2.0 w[3. 3.]  b:-1
误分类点:[1 1] a[2]:4.0 w[2. 2.]  b:-2
误分类点:[1 1] a[2]:5.0 w[1. 1.]  b:-3

