Chart.js与ECharts.js图表组件对比与使用
Chart.js与ECharts.js图表组件对比与使用
常用的 图表组件 Chart.js与ECharts.js的简要介绍与使用。
Chart.js
Chart.js官方网址。里面包括文档、例子和GitHub代码。界面小清新很漂亮。

例子很全。各种图表都有。点进去还可以修改数据条数、数据长度等等。
ECharts.js
ECharts.js官方网址。EChart.js是Apache出的图标组件库。与Chart.js相比,Echarts.js动态效果更优秀一些。界面看起来就更“上档次”。支持中英文切换,亲民。
例子界面,更全面更直观。每个例子点进去代码直接展示在左侧,图表结果展示在右侧,非常直观。
Chart.js与ECharts.js的区别之“画布”
Chart.js
Chart.js的展示部分需要使用canvas标签,再通过id来绑定script代码部分。
<div style=" width: 100%;display: flex;align-items: center;justify-content: center;">
	<div style="width: 70%;">
		<canvas id="myChart1"></canvas>
	</div>
</div>
ECharts.js
ECharts.js的展示部分直接使用div标签即可,注意必须规定画布的大小,再通过id来绑定script代码部分。
<div style=" width: 100%;display: flex;align-items: center;justify-content: center;">
	<div style="width: 70%;height: 500px;" id="myChart1"></div>
</div>
Chart.js与ECharts.js的区别之“语法”
具体语法代码写在script标签里面。画布中的id对应document.getElementById('myChart1');里的id。
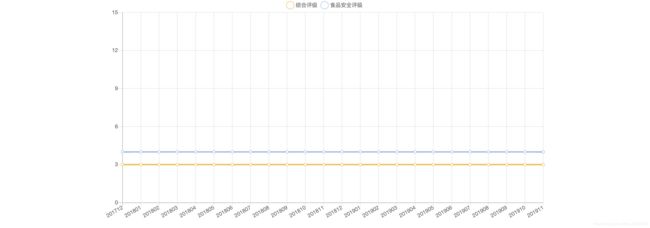
Chart.js线形图
Chart.js声明方式为:var chart = new Chart(ctx, option)
<script type="text/javascript">
            var ctx = document.getElementById('myChart1').getContext('2d');
            var chart = new Chart(ctx, {
                // The type of chart we want to create
                type: 'line',
                // The data for our dataset
                data: {
                    labels: ["201712", "201801", "201802", "201803", "201804", "201805", "201806",
                        "201807", "201808", "201809", "201810", "201811", "201812", "201901", "201902",
                        "201903", "201904", "201905", "201906", "201907", "201908", "201909", "201910",
                        "201911"
                    ],
                    datasets: [{
                            label: "综合评级",
                            fill: false, //是否填充,不填充就显示线。
                            backgroundColor: "rgba(242,190,64,1)", //线的颜色
                            borderColor: "rgba(242,190,64,1)",
                            pointBackgroundColor: "rgba(255,255,255,1)", //数据点的颜色
                            pointStrokeColor: "rgba(242,190,64,1)",
                            data: [3, 3, 3, 3, 3, 3, 3, 3, 3, 3, 3, 3, 3, 3, 3, 3, 3, 3, 3, 3, 3, 3, 3, 3],

                        },
                        {
                            label: "食品安全评级",
                            fill: false,
                            backgroundColor: "rgba(159,190,223,1)",
                            borderColor: "rgba(159,190,223,1)",
                            pointBackgroundColor: "rgba(255,255,255,1)",
                            pointStrokeColor: "rgba(159,190,223,1)",

                            data: [4, 4, 4, 4, 4, 4, 4, 4, 4, 4, 4, 4, 4, 4, 4, 4, 4, 4, 4, 4, 4, 4, 4, 4],
                        }
                    ]
                },

                // Configuration options go here
                options: {
                    customXLabelRota: 90,//x轴的标注倾斜展示
                    customXLabelRotaMinNumber: 90,//x轴的标注倾斜展示
                    scaleShowGridLines: false,
                    pointDot: true,
                    legend: {
                        labels: {
                            usePointStyle: true,//图例的样式使用点的样式
                        }
                    },
                    scales: {
                        yAxes: [{ //y轴
                            ticks: {
                                beginAtZero: true, //y轴从0开始
                                min: 0, //y轴最小值
                                max: 15, //y轴最大值
                                stepSize: 3 //y轴尺度跨度
                            }
                        }],
                        xAxes: [{
                            ticks: {}
                        }]
                    },

                }
            });
        </script>
ECharts.js线形图
ECharts.js声明方式为:var myChart = echarts.init(document.getElementById('myChart1'));
<script type="text/javascript">
            var myChart = echarts.init(document.getElementById('myChart1'));
            option = {
                legend: {
                    data: ['综合评级', '食品安全评级']
                },
                tooltip: {
                    trigger: 'axis', //鼠标覆盖出现辅助标线
                },
                grid: { //防止标签溢出
                    left: '3%',
                    right: '4%',
                    bottom: '3%',
                    containLabel: true
                },
                xAxis: {
                    type: 'category',
                    data: ["201712", "201801", "201802", "201803", "201804", "201805", "201806",
                        "201807", "201808", "201809", "201810", "201811", "201812", "201901", "201902",
                        "201903", "201904", "201905", "201906", "201907", "201908", "201909", "201910",
                        "201911"
                    ],
                    axisLabel: { //轴值倾斜展示
                        interval: 0,
                        rotate: 40
                    },
                },
                yAxis: {
                    type: 'value',
                    max: 15,
                },
                series: [{
                        name: '综合评级',
                        type: 'line',
                        // stack: '总量',

                        data: [3, 3, 3, 3, 3, 3, 3, 3, 3, 3, 3, 3, 3, 3, 3, 3, 3, 3, 3, 3, 3, 3, 3, 3],
                        // 显示数值
                        itemStyle: {
                            normal: {
                                color: "rgba(242,190,64,1)", //设置线条颜色
                                label: {
                                    show: true
                                }
                            }
                        },
                    },
                    {
                        name: '食品安全评级',
                        type: 'line',
                        // stack: '总量',
                        data: [4, 4, 4, 4, 4, 4, 4, 4, 4, 4, 4, 4, 4, 4, 4, 4, 4, 4, 4, 4, 4, 4, 4, 4],
                        // 显示数值
                        itemStyle: {
                            normal: {
                                color: "rgba(159,190,223,1)", //设置线条颜色
                                label: {
                                    show: true
                                }
                            }
                        },
                    }
                ]
            };
            myChart.setOption(option);//不写就画不出来哦
        </script>
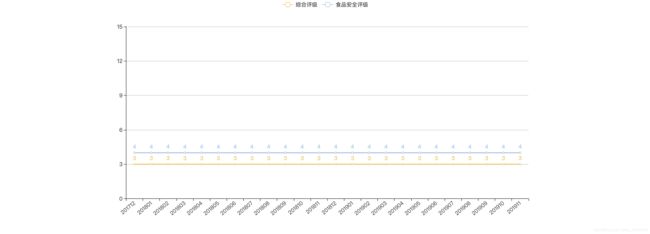
对比可以发现Chart.js是将dataset和option分开配置的,Echarts.js是将所有的配置、数据都写在option里面。
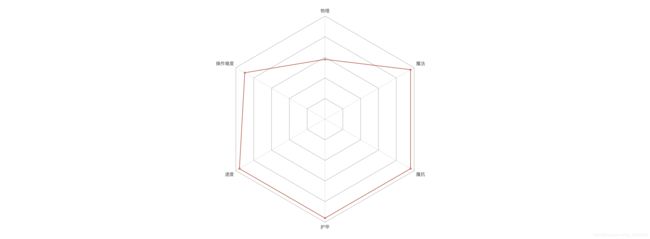
Chart.js雷达图
 <script type="text/javascript">
            var ctx2 = document.getElementById('myChart1').getContext('2d');
            var chart2 = new Chart(ctx2, {
                // The type of chart we want to create
                type: 'radar',
                // The data for our dataset
                data: {
                    labels: ["物理", "魔法", "魔抗", "护甲", "速度", "操作难度"],
                    datasets: [{
                        label: false,
                        fill: false,
                        backgroundColor: "rgba(174,29,0,1)",
                        borderColor: "rgba(174,29,0,1)",
                        borderWidth: 1,
                        pointBackgroundColor: "rgba(255,255,255,1)",
                        pointBorderColor: "rgba(174,29,0,1)",
                        pointDotStrokeWidth: 0.5,
                        pointRadius: 1.5,
                        backgroundColor: [
                            'rgba(255, 255, 255, 1)',
                            'rgba(238, 238, 238, 1)',
                            'rgba(255, 255, 255, 1)',
                            'rgba(238, 238, 238, 1)',

                        ],
                        data: [2.9, 4.8, 4.8, 4.8, 4.8, 4.5],

                    }]
                },

                // Configuration options go here
                options: {
                    legend: { //图例
                        display: false
                    },
                    scale: {
                        gridLines: { //网格
                            color: "#bbb",
                        },
                        ticks: { //刻度
                            display: false, //不展示轴尺度标记
                            beginAtZero: true,
                            suggestedMin: 0,
                            suggestedMax: 5,
                            stepSize: 1, //网格线间距步长
                        },
                    }
                }
            });
        </script>
ECharts.js雷达图
<script type="text/javascript">
            var myChart1 = echarts.init(document.getElementById('myChart1'));
            option = {
                title: {},
                tooltip: {},
                radar: {
                    // shape: 'circle',
                    name: {
                        textStyle: {
                            color: '#fff',
                            backgroundColor: '#999',
                            borderRadius: 3,
                            padding: [3, 5]
                        }
                    },
                    indicator: [{
                            name: '物理',
                            max: 5
                        },
                        {
                            name: '魔法',
                            max: 5
                        },
                        {
                            name: '魔抗',
                            max: 5
                        },
                        {
                            name: '护甲',
                            max: 5
                        },
                        {
                            name: '速度',
                            max: 5
                        },
                        {
                            name: '操作难度',
                            max: 5
                        }
                    ]
                },
                series: [{
                    type: 'radar',
                    // areaStyle: {normal: {}},
                    data: [{
                        value: [2.9, 4.8, 4.8, 4.8, 4.8, 4.5],
                        name: '大怪兽'//选择点的时候展示所有数据值和标题
                    }]
                }],

            };
            myChart1.setOption(option);
        </script>

两种组件库的雷达图样式不大一样,可以根据需求做出选择。
另外ECharts.js还支持3d效果的图表,相当炫酷。值得研究。