Week1-优衣库销售数据
课题背景
优衣库(英文名称:UNIQLO,日文假名发音:ユニクロ),为日本迅销公司的核心品牌,建立于1984年,当年是一家销售西服的小服装店,现已成为国际知名服装品牌。优衣库现任董事长兼总经理柳井正在日本首次引进了大卖场式的服装销售方式,通过独特的商品策划、开发和销售体系来实现店铺运作的低成本化,由此引发了优衣库的热卖潮。
优衣库(Uniqlo) 的内在涵义是指通过摒弃了不必要装潢装饰的仓储型店铺,采用超市型的自助购物方式,以合理可信的价格提供顾客希望的商品价廉物美的休闲装“UNIQLO”是Unique Clothing Warehouse的缩写,意为消费者提供“低价良品、品质保证”的经营理念,在日本经济低迷时期取得了惊人的业绩。
- 整体销售情况随着时间的变化是怎样的?
- 不同产品的销售情况是怎样的?顾客偏爱哪一种购买方式?
- 销售额和产品成本之间的关系怎么样?
数据表汇中数据字段含义:
[外链图片转存失败(img-c4ZUczY1-1567928726373)(attachment:image.png)]
import pandas as pd
import numpy as np
import seaborn as sns
import matplotlib.pyplot as plt
% matplotlib inline

Data=pd.read_csv('L2-W1-data-uniqlo.csv')
Data.info()
RangeIndex: 22293 entries, 0 to 22292
Data columns (total 12 columns):
store_id        22293 non-null int64
city            22293 non-null object
channel         22293 non-null object
gender_group    22293 non-null object
age_group       22293 non-null object
wkd_ind         22293 non-null object
product         22293 non-null object
customer        22293 non-null int64
revenue         22293 non-null float64
order           22293 non-null int64
quant           22293 non-null int64
unit_cost       22293 non-null int64
dtypes: float64(1), int64(5), object(6)
memory usage: 2.0+ MB
# 对数据进行清洗和整理
- (1) 一共有22293条数据
- (2) 12个columns
- (3)列表没有空值-null
Data.head(3)
| store_id | city | channel | gender_group | age_group | wkd_ind | product | customer | revenue | order | quant | unit_cost | |
|---|---|---|---|---|---|---|---|---|---|---|---|---|
| 0 | 658 | 深圳 | 线下 | Female | 25-29 | Weekday | 当季新品 | 4 | 796.0 | 4 | 4 | 59 |
| 1 | 146 | 杭州 | 线下 | Female | 25-29 | Weekday | 运动 | 1 | 149.0 | 1 | 1 | 49 |
| 2 | 70 | 深圳 | 线下 | Male | >=60 | Weekday | T恤 | 2 | 178.0 | 2 | 2 | 49 |
Data.describe()
| store_id | customer | revenue | order | quant | unit_cost | |
|---|---|---|---|---|---|---|
| count | 22293.000000 | 22293.000000 | 22293.000000 | 22293.000000 | 22293.000000 | 22293.000000 |
| mean | 335.391558 | 1.629480 | 159.531371 | 1.651998 | 1.858072 | 46.124658 |
| std | 230.236167 | 1.785605 | 276.254066 | 1.861480 | 2.347301 | 19.124347 |
| min | 19.000000 | 1.000000 | -0.660000 | 1.000000 | 1.000000 | 9.000000 |
| 25% | 142.000000 | 1.000000 | 64.000000 | 1.000000 | 1.000000 | 49.000000 |
| 50% | 315.000000 | 1.000000 | 99.000000 | 1.000000 | 1.000000 | 49.000000 |
| 75% | 480.000000 | 2.000000 | 175.000000 | 2.000000 | 2.000000 | 49.000000 |
| max | 831.000000 | 58.000000 | 12538.000000 | 65.000000 | 84.000000 | 99.000000 |
发现:revenue的min是负值;
[外链图片转存失败(img-Xgk9drZS-1567928726383)(attachment:image.png)]
#发现异常 20049 91 武汉 线上 Female 55-59 Weekday 运动 1 -0.66 1 2 49
##判断是否有缺失值
Data.isnull().any()#每个字段是否有缺失值
## 解果没有发现有缺失值
store_id        False
city            False
channel         False
gender_group    False
age_group       False
wkd_ind         False
product         False
customer        False
revenue         False
order           False
quant           False
unit_cost       False
dtype: bool
# 清楚异常值
Data0=Data[Data['revenue']>=0]
Data0.describe()
| store_id | customer | revenue | order | quant | unit_cost | |
|---|---|---|---|---|---|---|
| count | 22292.000000 | 22292.000000 | 22292.000000 | 22292.000000 | 22292.000000 | 22292.000000 |
| mean | 335.402521 | 1.629508 | 159.538557 | 1.652028 | 1.858066 | 46.124529 |
| std | 230.235512 | 1.785640 | 276.258179 | 1.861517 | 2.347353 | 19.124766 |
| min | 19.000000 | 1.000000 | 0.000000 | 1.000000 | 1.000000 | 9.000000 |
| 25% | 142.000000 | 1.000000 | 64.000000 | 1.000000 | 1.000000 | 49.000000 |
| 50% | 315.000000 | 1.000000 | 99.000000 | 1.000000 | 1.000000 | 49.000000 |
| 75% | 480.000000 | 2.000000 | 175.000000 | 2.000000 | 2.000000 | 49.000000 |
| max | 831.000000 | 58.000000 | 12538.000000 | 65.000000 | 84.000000 | 99.000000 |
问题一:整体销售情况随着时间的变化是怎样的?
题目拆解:
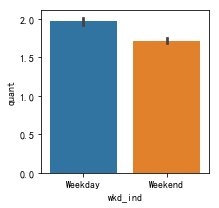
数据中与时间有关的字段仅为类别变量wkd_ind代表的Weekday和Weekend,即购买发生的时间是周中还是周末。本题意为分析对比周末和周中与销售有关的数据,包括产品销售数量quant、销售金额revenue、顾客人数customer的情况,可生成柱状图进行可视化。
# 产品销售数量quant、销售金额revenue、顾客人数customer  柱状图
plt.figure(figsize=(3,3))
sns.barplot(x='wkd_ind',y='quant',data=Data0)  #quant
E:\Anaconda3\lib\site-packages\scipy\stats\stats.py:1713: FutureWarning: Using a non-tuple sequence for multidimensional indexing is deprecated; use `arr[tuple(seq)]` instead of `arr[seq]`. In the future this will be interpreted as an array index, `arr[np.array(seq)]`, which will result either in an error or a different result.
  return np.add.reduce(sorted[indexer] * weights, axis=axis) / sumval
plt.figure(figsize=(3,3))
sns.barplot(x='wkd_ind',y='revenue',data=Data0)  #revenue
E:\Anaconda3\lib\site-packages\scipy\stats\stats.py:1713: FutureWarning: Using a non-tuple sequence for multidimensional indexing is deprecated; use `arr[tuple(seq)]` instead of `arr[seq]`. In the future this will be interpreted as an array index, `arr[np.array(seq)]`, which will result either in an error or a different result.
  return np.add.reduce(sorted[indexer] * weights, axis=axis) / sumval
plt.figure(figsize=(3,3))
sns.barplot(x='wkd_ind',y='customer',data=Data0)  #customer
E:\Anaconda3\lib\site-packages\scipy\stats\stats.py:1713: FutureWarning: Using a non-tuple sequence for multidimensional indexing is deprecated; use `arr[tuple(seq)]` instead of `arr[seq]`. In the future this will be interpreted as an array index, `arr[np.array(seq)]`, which will result either in an error or a different result.
  return np.add.reduce(sorted[indexer] * weights, axis=axis) / sumval
发现:quant、revenue与customer 均呈现周中大于周末的结果
问题二:不同产品的销售情况是怎样的?顾客偏爱哪一种购买方式?
题目拆解:
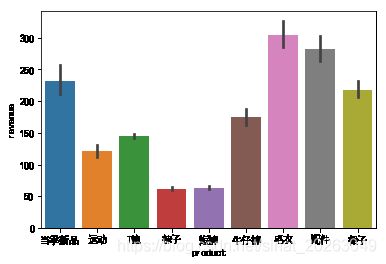
- 不同产品即指product字段中不同类别的产品,销售情况即为销售额revenue,可生成柱状图进行可视化
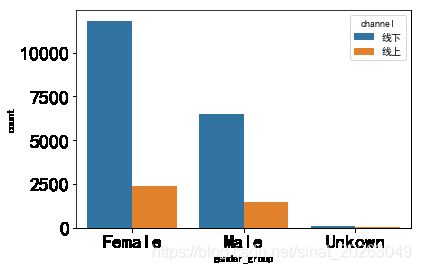
- 购买方式只有channel是线上还是线下这一个指标,而顾客可以从不同性别gender_group、年龄段age_group、城市city三个维度进行分解,因此本问即为探究不同性别、年龄段和城市的顾客对线上、线下两种购买方式的偏好,可生成柱状图进行可视化的呈现
#不同产品即指product与销售额revenue 统计描述
Data0.groupby(['product'])['revenue'].describe()
| count | mean | std | min | 25% | 50% | 75% | max | |
|---|---|---|---|---|---|---|---|---|
| product | ||||||||
| T恤 | 10610.0 | 145.027789 | 154.278714 | 0.0 | 79.0 | 99.0 | 158.0 | 6636.00 |
| 当季新品 | 2540.0 | 232.545228 | 597.253282 | 0.0 | 76.0 | 111.0 | 197.0 | 12538.00 |
| 毛衣 | 807.0 | 304.375217 | 290.733202 | 0.0 | 149.0 | 199.0 | 396.0 | 4975.00 |
| 牛仔裤 | 1412.0 | 174.311246 | 238.681718 | 0.0 | 59.0 | 79.0 | 199.0 | 2087.00 |
| 短裤 | 1694.0 | 63.450933 | 55.646467 | 0.0 | 37.0 | 40.0 | 77.0 | 676.00 |
| 袜子 | 2053.0 | 62.216931 | 51.183226 | 0.0 | 27.0 | 52.0 | 79.0 | 595.36 |
| 裙子 | 629.0 | 218.287409 | 172.449212 | 10.0 | 99.0 | 197.0 | 237.0 | 1442.00 |
| 运动 | 975.0 | 121.087528 | 142.760425 | 18.0 | 39.0 | 78.0 | 149.0 | 1257.00 |
| 配件 | 1572.0 | 282.878594 | 398.705054 | 0.0 | 99.0 | 149.0 | 298.0 | 4187.00 |
plt.figure(figsize=(6,4))
sns.barplot(x='product',y='revenue',hue=None,data=Data0)
E:\Anaconda3\lib\site-packages\scipy\stats\stats.py:1713: FutureWarning: Using a non-tuple sequence for multidimensional indexing is deprecated; use `arr[tuple(seq)]` instead of `arr[seq]`. In the future this will be interpreted as an array index, `arr[np.array(seq)]`, which will result either in an error or a different result.
  return np.add.reduce(sorted[indexer] * weights, axis=axis) / sumval
发现:毛衣、配件、当季新品与裙子销售金额较大(降序)
#不同性别gender_group、年龄段age_group、城市city的顾客对线上、线下两种购买方式的偏好

#不同性别gender_group 的顾客对线上、线下两种购买方式的偏好
plt.rcParams['font.sans-serif'] = 'SimHei'
plt.rcParams['axes.unicode_minus'] = False
sns.countplot(x='gender_group',hue='channel',data=Data0,order=Data0['gender_group'].value_counts().index)
plt.tick_params(labelsize=20)
#年龄段age_group 的顾客对线上、线下两种购买方式的偏好
sns.countplot(x='age_group',hue='channel',data=Data0,order=Data0['age_group'].value_counts().index)
plt.tick_params(labelsize=9)
#城市city 的顾客对线上、线下两种购买方式的偏好
sns.countplot(x='city',hue='channel',data=Data0,order=Data0['city'].value_counts().index)
plt.tick_params(labelsize=9)
发现:从不同性别gender_group、年龄段age_group、城市city三个维度看,顾客对更喜爱线下的购买方式
问题三:销售额和产品成本之间的关系怎么样?
题目拆解:
- 每单顾客的总销售额为revenue,根据数量quant可以计算出单件产品销售金额,又已知单件产品成本为unit_cost和其类别product。
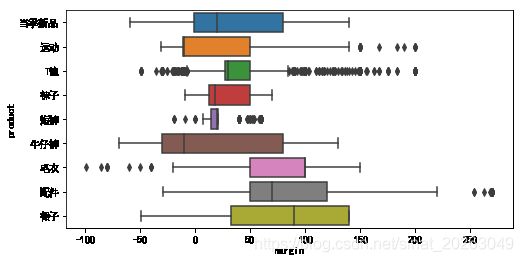
- 思路一:单件产品销售额-成本为利润margin,margin是如何分布的?是否存在亏本销售的产品?
- 思路二:探究实际销售额和产品成本之间的关系,即为求它们之间的相关,若成正相关,则产品成本越高,销售额越高,或许为高端商品;若成负相关,则成本越低,销售额越高,为薄利多销的模式。
- 还可以拆分得更细,探究不同城市和门店中成本和销售额的相关性。
#单件产品销售金额
Data0['unit_price'] = (Data0['revenue']/Data0['quant'])  #单价
Data0['margin'] = (Data0['revenue']/Data0['quant']-Data0['unit_cost'])   #利润
Data0['margin'].describe()
E:\Anaconda3\lib\site-packages\ipykernel_launcher.py:2: SettingWithCopyWarning:
A value is trying to be set on a copy of a slice from a DataFrame.
Try using .loc[row_indexer,col_indexer] = value instead

See the caveats in the documentation: http://pandas.pydata.org/pandas-docs/stable/indexing.html#indexing-view-versus-copy

E:\Anaconda3\lib\site-packages\ipykernel_launcher.py:3: SettingWithCopyWarning:
A value is trying to be set on a copy of a slice from a DataFrame.
Try using .loc[row_indexer,col_indexer] = value instead

See the caveats in the documentation: http://pandas.pydata.org/pandas-docs/stable/indexing.html#indexing-view-versus-copy
  This is separate from the ipykernel package so we can avoid doing imports until


count    22292.000000
mean        38.144962
std         40.265440
min        -99.000000
25%         14.000000
50%         30.000000
75%         50.000000
max        270.000000
Name: margin, dtype: float64
#margin何分布  绘制直方图
#解决中文符号不正常显示问题
plt.rcParams['font.sans-serif'] = 'SimHei'
plt.rcParams['axes.unicode_minus'] = False
Data0['margin'].plot(kind='hist',color='violet',legend=True,edgecolor = 'k',title='总体销售利润分布')
plt.xlabel('利润')
plt.ylabel('计数')
Text(0,0.5,'计数')
发现:总体销售利润是呈现盈利状态,且主要是单件低利润占主要部分,集中在0-100左右
# 销售产品种类与利润的分布关系 箱线图
plt.figure(figsize=(8,4))
sns.boxplot(y = 'product',x='margin',data = Data0)
发现:
- (1)牛仔裤属于亏本销售产品(亏损严重),其次是运动类
- (2)裙子和配件是盈利比较高的两类商品
- (3)T恤的利润波动较大
#探究实际销售额和产品成本之间的关系,即为求它们之间的相关性(求不同产品的销售额与成本之间的相关性)
#若成正相关,则产品成本越高,销售额越高,或许为高端商品;若成负相关,则成本越低,销售额越高,为薄利多销的模式。
Data0.groupby(['product'])['revenue','unit_cost'].corr()
| revenue | unit_cost | ||
|---|---|---|---|
| product | |||
| T恤 | revenue | 1.0 | NaN |
| unit_cost | NaN | NaN | |
| 当季新品 | revenue | 1.0 | NaN |
| unit_cost | NaN | NaN | |
| 毛衣 | revenue | 1.0 | NaN |
| unit_cost | NaN | NaN | |
| 牛仔裤 | revenue | 1.0 | NaN |
| unit_cost | NaN | NaN | |
| 短裤 | revenue | 1.0 | NaN |
| unit_cost | NaN | NaN | |
| 袜子 | revenue | 1.0 | NaN |
| unit_cost | NaN | NaN | |
| 裙子 | revenue | 1.0 | NaN |
| unit_cost | NaN | NaN | |
| 运动 | revenue | 1.0 | NaN |
| unit_cost | NaN | NaN | |
| 配件 | revenue | 1.0 | NaN |
| unit_cost | NaN | NaN |
分组求相关的结果???
DataFrame.corr(method=‘pearson’, min_periods=1) 参数详解
参数说明:
method:可选值为{‘pearson’, ‘kendall’, ‘spearman’}
           pearson:Pearson相关系数来衡量两个数据集合是否在一条线上面,即针对线性数据的相关系数计算,针对非线性                                           数据便会有误差。

            kendall:用于反映分类变量相关性的指标,即针对无序序列的相关系数,非正太分布的数据

            spearman:非线性的,非正太分析的数据的相关系数
min_periods:样本最少的数据量
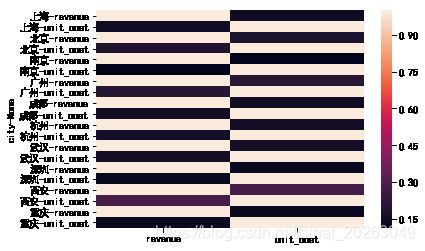
# 探究不同城市和门店中成本和销售额的相关性。
Data0.groupby(['city'])['revenue','unit_cost'].corr()
| revenue | unit_cost | ||
|---|---|---|---|
| city | |||
| 上海 | revenue | 1.000000 | 0.146763 |
| unit_cost | 0.146763 | 1.000000 | |
| 北京 | revenue | 1.000000 | 0.183747 |
| unit_cost | 0.183747 | 1.000000 | |
| 南京 | revenue | 1.000000 | 0.112418 |
| unit_cost | 0.112418 | 1.000000 | |
| 广州 | revenue | 1.000000 | 0.205299 |
| unit_cost | 0.205299 | 1.000000 | |
| 成都 | revenue | 1.000000 | 0.152857 |
| unit_cost | 0.152857 | 1.000000 | |
| 杭州 | revenue | 1.000000 | 0.157356 |
| unit_cost | 0.157356 | 1.000000 | |
| 武汉 | revenue | 1.000000 | 0.164363 |
| unit_cost | 0.164363 | 1.000000 | |
| 深圳 | revenue | 1.000000 | 0.133183 |
| unit_cost | 0.133183 | 1.000000 | |
| 西安 | revenue | 1.000000 | 0.277920 |
| unit_cost | 0.277920 | 1.000000 | |
| 重庆 | revenue | 1.000000 | 0.138661 |
| unit_cost | 0.138661 | 1.000000 |
#热力图
sns.heatmap(Data0.groupby(['city'])['revenue','unit_cost'].corr(),)
