机器学习c12笔记:SVM学习与SVM,逻辑回归和kNN比较
SVM
摘自百度百科
参考书籍:机器学习实用案例解析
SVM原理
SVM方法是通过一个非线性映射p,把样本空间映射到一个高维乃至无穷维的特征空间中(Hilbert空间),使得在原来的样本空间中非线性可分的问题转化为在特征空间中的线性可分的问题.简单地说,就是升维和线性化.升维,就是把样本向高维空间做映射,一般情况下这会增加计算的复杂性,甚至会引起“维数灾难”,因而人们很少问津.但是作为分类、回归等问题来说,很可能在低维样本空间无法线性处理的样本集,在高维特征空间中却可以通过一个线性超平面实现线性划分(或回归).一般的升维都会带来计算的复杂化,SVM方法巧妙地解决了这个难题:应用核函数的展开定理,就不需要知道非线性映射的显式表达式;由于是在高维特征空间中建立线性学习机,所以与线性模型相比,不但几乎不增加计算的复杂性,而且在某种程度上避免了“维数灾难”.这一切要归功于核函数的展开和计算理论.
选择不同的核函数,可以生成不同的SVM,常用的核函数有以下4种:
1. 线性核函数K(x,y)=x·y;
2. 多项式核函数K(x,y)=[(x·y)+1]^d;
3. 径向基函数K(x,y)=exp(-|x-y|^2/d^2)
4. 二层神经网络核函数K(x,y)=tanh(a(x·y)+b).
一般特征
- SVM学习问题可以表示为凸优化问题,因此可以利用已知的有效算法发现目标函数的全局最小值。而其他分类方法(如基于规则的分类器和人工神经网络)都采用一种基于贪心学习的策略来搜索假设空间,这种方法一般只能获得局部最优解。
- SVM通过最大化决策边界的边缘来控制模型的能力。尽管如此,用户必须提供其他参数,如使用核函数类型和引入松弛变量等。
- 通过对数据中每个分类属性引入一个哑变量,SVM可以应用于分类数据。
- SVM一般只能用在二类问题,对于多类问题效果不好。
逻辑回归
library('ggplot2')

# First code snippet
df <- read.csv(file.path('data', 'df.csv'))

logit.fit <- glm(Label ~ X + Y,
                 family = binomial(link = 'logit'),
                 data = df)

logit.predictions <- ifelse(predict(logit.fit) > 0, 1, 0)

mean(with(df, logit.predictions == Label))
#[1] 0.5156
SVM分类
library('e1071')

svm.fit <- svm(Label ~ X + Y, data = df)
svm.predictions <- ifelse(predict(svm.fit) > 0, 1, 0)
mean(with(df, svm.predictions == Label))
#[1] 0.7204
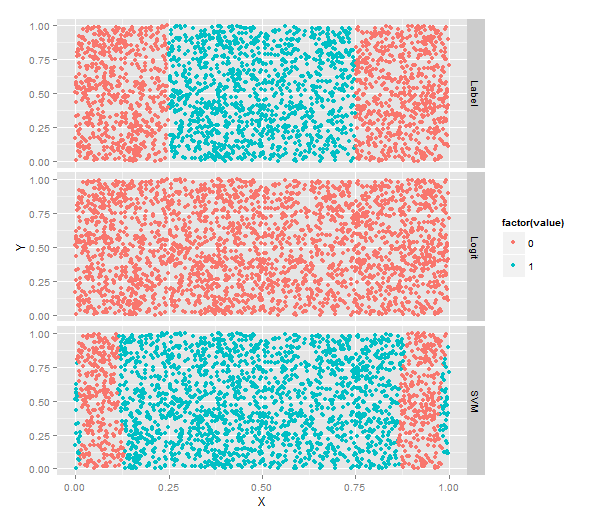
二者分类比较
# Third code snippet
library("reshape")
df <- cbind(df,
            data.frame(Logit = ifelse(predict(logit.fit) > 0, 1, 0),
                       SVM = ifelse(predict(svm.fit) > 0, 1, 0)))

predictions <- melt(df, id.vars = c('X', 'Y'))# 将数据进行reshape!!!

ggplot(predictions, aes(x = X, y = Y, color = factor(value))) +
  geom_point() +
  facet_grid(variable ~ .)#按照不同vareable分行画图!
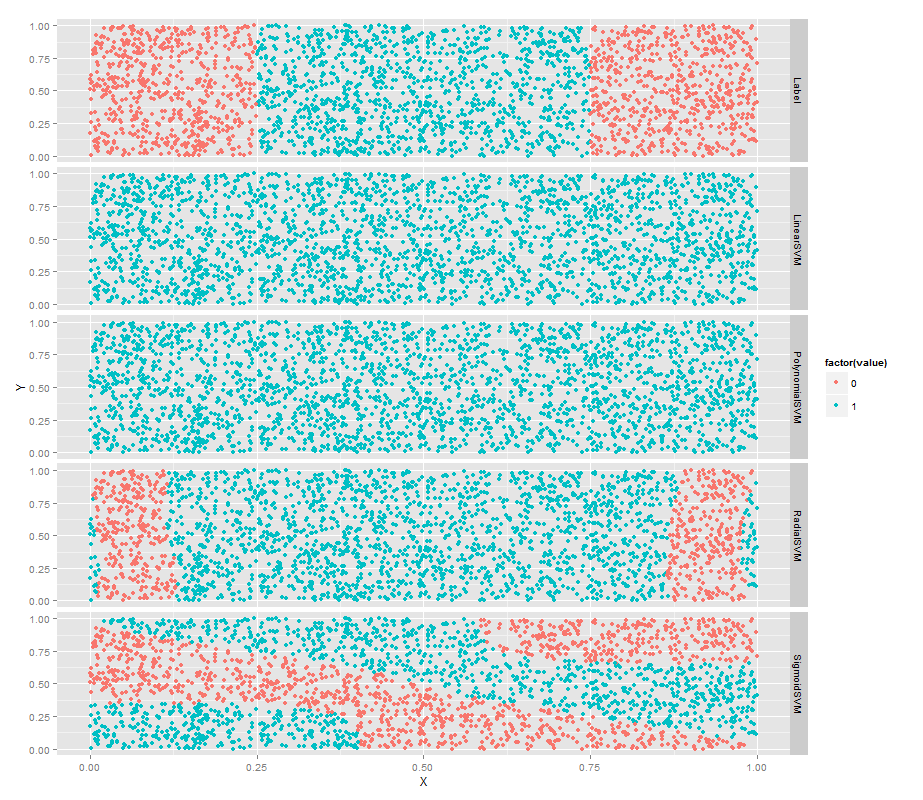
不同核方法分类结果比较
常用的核函数有以下4种:
1. 线性核函数K(x,y)=x·y;
2. 多项式核函数K(x,y)=[(x·y)+1]^d;
3. 径向基函数K(x,y)=exp(-|x-y|^2/d^2)
4. 二层神经网络核函数K(x,y)=tanh(a(x·y)+b)(S行核函数)
# Fourth code snippet
df <- df[, c('X', 'Y', 'Label')]

linear.svm.fit <- svm(Label ~ X + Y, data = df, kernel = 'linear')
with(df, mean(Label == ifelse(predict(linear.svm.fit) > 0, 1, 0)))

polynomial.svm.fit <- svm(Label ~ X + Y, data = df, kernel = 'polynomial')
with(df, mean(Label == ifelse(predict(polynomial.svm.fit) > 0, 1, 0)))

radial.svm.fit <- svm(Label ~ X + Y, data = df, kernel = 'radial')
with(df, mean(Label == ifelse(predict(radial.svm.fit) > 0, 1, 0)))

sigmoid.svm.fit <- svm(Label ~ X + Y, data = df, kernel = 'sigmoid')
with(df, mean(Label == ifelse(predict(sigmoid.svm.fit) > 0, 1, 0)))

df <- cbind(df,
            data.frame(LinearSVM = ifelse(predict(linear.svm.fit) > 0, 1, 0),
                       PolynomialSVM = ifelse(predict(polynomial.svm.fit) > 0, 1, 0),
                       RadialSVM = ifelse(predict(radial.svm.fit) > 0, 1, 0),
                       SigmoidSVM = ifelse(predict(sigmoid.svm.fit) > 0, 1, 0)))

predictions <- melt(df, id.vars = c('X', 'Y'))

ggplot(predictions, aes(x = X, y = Y, color = factor(value))) +
  geom_point() +
  facet_grid(variable ~ .)
SVM的超参数设置
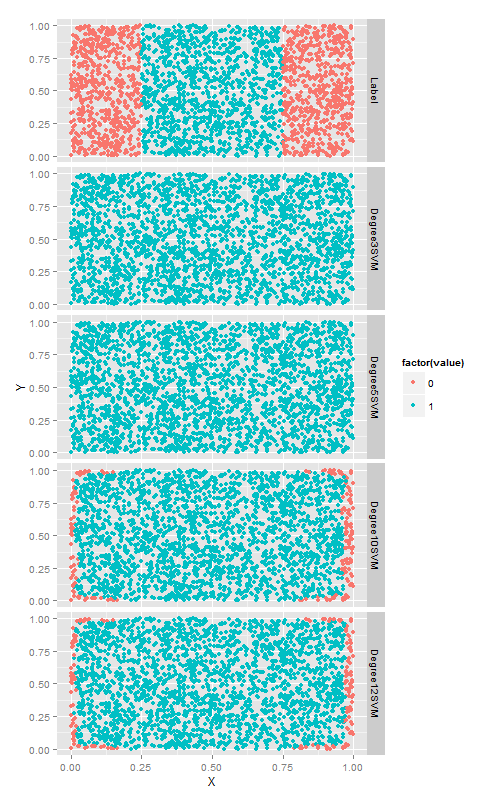
多项式核函数的多项式次数degree
library('ggplot2')

# First code snippet
df <- read.csv(file.path('data', 'df.csv'))

logit.fit <- glm(Label ~ X + Y,
                 family = binomial(link = 'logit'),
                 data = df)

logit.predictions <- ifelse(predict(logit.fit) > 0, 1, 0)

mean(with(df, logit.predictions == Label))
#[1] 0.5156

mean(with(df, 0 == Label))
#[1] 0.5156

# Second code snippet
library('e1071')

svm.fit <- svm(Label ~ X + Y, data = df)
svm.predictions <- ifelse(predict(svm.fit) > 0, 1, 0)
mean(with(df, svm.predictions == Label))
#[1] 0.7204

# Third code snippet
library("reshape")
df <- cbind(df,
            data.frame(Logit = ifelse(predict(logit.fit) > 0, 1, 0),
                       SVM = ifelse(predict(svm.fit) > 0, 1, 0)))

predictions <- melt(df, id.vars = c('X', 'Y'))

ggplot(predictions, aes(x = X, y = Y, color = factor(value))) +
  geom_point() +
  facet_grid(variable ~ .)

# Fourth code snippet
df <- df[, c('X', 'Y', 'Label')]

linear.svm.fit <- svm(Label ~ X + Y, data = df, kernel = 'linear')
with(df, mean(Label == ifelse(predict(linear.svm.fit) > 0, 1, 0)))

polynomial.svm.fit <- svm(Label ~ X + Y, data = df, kernel = 'polynomial')
with(df, mean(Label == ifelse(predict(polynomial.svm.fit) > 0, 1, 0)))

radial.svm.fit <- svm(Label ~ X + Y, data = df, kernel = 'radial')
with(df, mean(Label == ifelse(predict(radial.svm.fit) > 0, 1, 0)))

sigmoid.svm.fit <- svm(Label ~ X + Y, data = df, kernel = 'sigmoid')
with(df, mean(Label == ifelse(predict(sigmoid.svm.fit) > 0, 1, 0)))

df <- cbind(df,
            data.frame(LinearSVM = ifelse(predict(linear.svm.fit) > 0, 1, 0),
                       PolynomialSVM = ifelse(predict(polynomial.svm.fit) > 0, 1, 0),
                       RadialSVM = ifelse(predict(radial.svm.fit) > 0, 1, 0),
                       SigmoidSVM = ifelse(predict(sigmoid.svm.fit) > 0, 1, 0)))

predictions <- melt(df, id.vars = c('X', 'Y'))

ggplot(predictions, aes(x = X, y = Y, color = factor(value))) +
  geom_point() +
  facet_grid(variable ~ .)

# Fifth code snippet
polynomial.degree3.svm.fit <- svm(Label ~ X + Y,
                                  data = df,
                                  kernel = 'polynomial',
                                  degree = 3)
with(df, mean(Label != ifelse(predict(polynomial.degree3.svm.fit) > 0, 1, 0)))
#[1] 0.5156

polynomial.degree5.svm.fit <- svm(Label ~ X + Y,
                                  data = df,
                                  kernel = 'polynomial',
                                  degree = 5)
with(df, mean(Label != ifelse(predict(polynomial.degree5.svm.fit) > 0, 1, 0)))
#[1] 0.5156

polynomial.degree10.svm.fit <- svm(Label ~ X + Y,
                                   data = df,
                                   kernel = 'polynomial',
                                   degree = 10)
with(df, mean(Label != ifelse(predict(polynomial.degree10.svm.fit) > 0, 1, 0)))
#[1] 0.4388

polynomial.degree12.svm.fit <- svm(Label ~ X + Y,
                                   data = df,
                                   kernel = 'polynomial',
                                   degree = 12)
with(df, mean(Label != ifelse(predict(polynomial.degree12.svm.fit) > 0, 1, 0)))
#[1] 0.4464

# Sixth code snippet
df <- df[, c('X', 'Y', 'Label')]

df <- cbind(df,
            data.frame(Degree3SVM = ifelse(predict(polynomial.degree3.svm.fit) > 0,
                                           1,
                                           0),
                       Degree5SVM = ifelse(predict(polynomial.degree5.svm.fit) > 0,
                                           1,
                                           0),
                       Degree10SVM = ifelse(predict(polynomial.degree10.svm.fit) > 0,
                                            1,
                                            0),
                       Degree12SVM = ifelse(predict(polynomial.degree12.svm.fit) > 0,
                                            1,
                                            0)))

predictions <- melt(df, id.vars = c('X', 'Y'))

ggplot(predictions, aes(x = X, y = Y, color = factor(value))) +
  geom_point() +
facet_grid(variable ~ .)更大的degree带来了准确率的的提升,但是,耗费的时间越来越长.最后我们在第六章进行多项式过拟合的问题又发生了.因此,在使用多项式核函数来应用svm时一定要注意交叉验证!
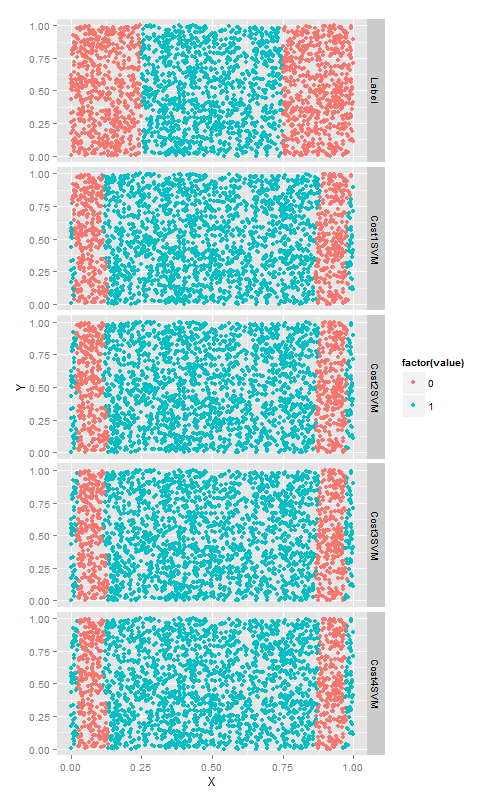
cost超参数
cost超参数他可以与任何一种SVM核函数相配合.以径向基函数为例,尝试4个不同的cost值,来看改变cost值带来的变化. 这次数分类正确的点的个数.
cost参数是一个正则化超参数,就像在第六章描述的lambda参数一样,因此增加cost只会使得模型与训练数据拟合的更差一些.当然,正则化会使你的模型在测试集上的效果更好,因此最好使用测试集进行交叉验证.
library('ggplot2')

# First code snippet
df <- read.csv(file.path('data', 'df.csv'))

logit.fit <- glm(Label ~ X + Y,
                 family = binomial(link = 'logit'),
                 data = df)

logit.predictions <- ifelse(predict(logit.fit) > 0, 1, 0)

mean(with(df, logit.predictions == Label))
#[1] 0.5156

mean(with(df, 0 == Label))
#[1] 0.5156

# Second code snippet
library('e1071')

svm.fit <- svm(Label ~ X + Y, data = df)
svm.predictions <- ifelse(predict(svm.fit) > 0, 1, 0)
mean(with(df, svm.predictions == Label))
#[1] 0.7204

# Third code snippet
library("reshape")
df <- cbind(df,
            data.frame(Logit = ifelse(predict(logit.fit) > 0, 1, 0),
                       SVM = ifelse(predict(svm.fit) > 0, 1, 0)))

predictions <- melt(df, id.vars = c('X', 'Y'))

ggplot(predictions, aes(x = X, y = Y, color = factor(value))) +
  geom_point() +
  facet_grid(variable ~ .)

# Fourth code snippet
df <- df[, c('X', 'Y', 'Label')]

linear.svm.fit <- svm(Label ~ X + Y, data = df, kernel = 'linear')
with(df, mean(Label == ifelse(predict(linear.svm.fit) > 0, 1, 0)))

polynomial.svm.fit <- svm(Label ~ X + Y, data = df, kernel = 'polynomial')
with(df, mean(Label == ifelse(predict(polynomial.svm.fit) > 0, 1, 0)))

radial.svm.fit <- svm(Label ~ X + Y, data = df, kernel = 'radial')
with(df, mean(Label == ifelse(predict(radial.svm.fit) > 0, 1, 0)))

sigmoid.svm.fit <- svm(Label ~ X + Y, data = df, kernel = 'sigmoid')
with(df, mean(Label == ifelse(predict(sigmoid.svm.fit) > 0, 1, 0)))

df <- cbind(df,
            data.frame(LinearSVM = ifelse(predict(linear.svm.fit) > 0, 1, 0),
                       PolynomialSVM = ifelse(predict(polynomial.svm.fit) > 0, 1, 0),
                       RadialSVM = ifelse(predict(radial.svm.fit) > 0, 1, 0),
                       SigmoidSVM = ifelse(predict(sigmoid.svm.fit) > 0, 1, 0)))

predictions <- melt(df, id.vars = c('X', 'Y'))

ggplot(predictions, aes(x = X, y = Y, color = factor(value))) +
  geom_point() +
  facet_grid(variable ~ .)

# Fifth code snippet
polynomial.degree3.svm.fit <- svm(Label ~ X + Y,
                                  data = df,
                                  kernel = 'polynomial',
                                  degree = 3)
with(df, mean(Label != ifelse(predict(polynomial.degree3.svm.fit) > 0, 1, 0)))
#[1] 0.5156

polynomial.degree5.svm.fit <- svm(Label ~ X + Y,
                                  data = df,
                                  kernel = 'polynomial',
                                  degree = 5)
with(df, mean(Label != ifelse(predict(polynomial.degree5.svm.fit) > 0, 1, 0)))
#[1] 0.5156

polynomial.degree10.svm.fit <- svm(Label ~ X + Y,
                                   data = df,
                                   kernel = 'polynomial',
                                   degree = 10)
with(df, mean(Label != ifelse(predict(polynomial.degree10.svm.fit) > 0, 1, 0)))
#[1] 0.4388

polynomial.degree12.svm.fit <- svm(Label ~ X + Y,
                                   data = df,
                                   kernel = 'polynomial',
                                   degree = 12)
with(df, mean(Label != ifelse(predict(polynomial.degree12.svm.fit) > 0, 1, 0)))
#[1] 0.4464

# Sixth code snippet
df <- df[, c('X', 'Y', 'Label')]

df <- cbind(df,
            data.frame(Degree3SVM = ifelse(predict(polynomial.degree3.svm.fit) > 0,
                                           1,
                                           0),
                       Degree5SVM = ifelse(predict(polynomial.degree5.svm.fit) > 0,
                                           1,
                                           0),
                       Degree10SVM = ifelse(predict(polynomial.degree10.svm.fit) > 0,
                                            1,
                                            0),
                       Degree12SVM = ifelse(predict(polynomial.degree12.svm.fit) > 0,
                                            1,
                                            0)))

predictions <- melt(df, id.vars = c('X', 'Y'))

ggplot(predictions, aes(x = X, y = Y, color = factor(value))) +
  geom_point() +
  facet_grid(variable ~ .)
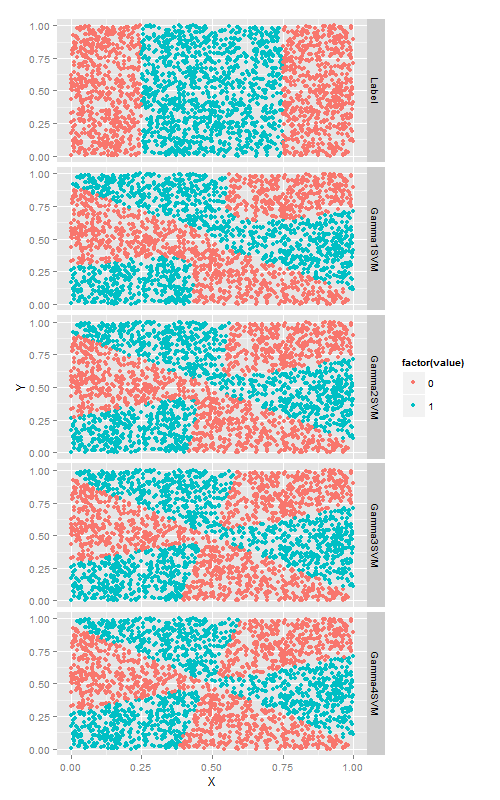
gamma超参数
在S核函数上使用gamma, 直观的讲,改变gamma时, 由S型核函数生成的相当复杂的决策边界会随之弯曲变形.
# Ninth code snippet
sigmoid.gamma1.svm.fit <- svm(Label ~ X + Y,
                              data = df,
                              kernel = 'sigmoid',
                              gamma = 1)
with(df, mean(Label == ifelse(predict(sigmoid.gamma1.svm.fit) > 0, 1, 0)))
#[1] 0.478

sigmoid.gamma2.svm.fit <- svm(Label ~ X + Y,
                              data = df,
                              kernel = 'sigmoid',
                              gamma = 2)
with(df, mean(Label == ifelse(predict(sigmoid.gamma2.svm.fit) > 0, 1, 0)))
#[1] 0.4824

sigmoid.gamma3.svm.fit <- svm(Label ~ X + Y,
                              data = df,
                              kernel = 'sigmoid',
                              gamma = 3)
with(df, mean(Label == ifelse(predict(sigmoid.gamma3.svm.fit) > 0, 1, 0)))
#[1] 0.4816

sigmoid.gamma4.svm.fit <- svm(Label ~ X + Y,
                              data = df,
                              kernel = 'sigmoid',
                              gamma = 4)
with(df, mean(Label == ifelse(predict(sigmoid.gamma4.svm.fit) > 0, 1, 0)))
#[1] 0.4824

# Tenth code snippet
df <- df[, c('X', 'Y', 'Label')]

df <- cbind(df,
            data.frame(Gamma1SVM = ifelse(predict(sigmoid.gamma1.svm.fit) > 0, 1, 0),
                       Gamma2SVM = ifelse(predict(sigmoid.gamma2.svm.fit) > 0, 1, 0),
                       Gamma3SVM = ifelse(predict(sigmoid.gamma3.svm.fit) > 0, 1, 0),
                       Gamma4SVM = ifelse(predict(sigmoid.gamma4.svm.fit) > 0, 1, 0)))

predictions <- melt(df, id.vars = c('X', 'Y'))

ggplot(predictions, aes(x = X, y = Y, color = factor(value))) +
  geom_point() +
  facet_grid(variable ~ .)
算法比较
SVM,逻辑回归,kNN算法在分类中的比较.
读取数据选取训练测试集合
# Eleventh code snippet
load(file.path('data', 'dtm.RData'))

set.seed(1)

training.indices <- sort(sample(1:nrow(dtm), round(0.5 * nrow(dtm))))
test.indices <- which(! 1:nrow(dtm) %in% training.indices)

train.x <- dtm[training.indices, 3:ncol(dtm)]
train.y <- dtm[training.indices, 1]

test.x <- dtm[test.indices, 3:ncol(dtm)]
test.y <- dtm[test.indices, 1]

rm(dtm)
逻辑回归
正则化的逻辑回归拟合
# Twelfth code snippet
library('glmnet')
regularized.logit.fit <- glmnet(train.x, train.y, family = c('binomial'))
模型调优,交叉验证
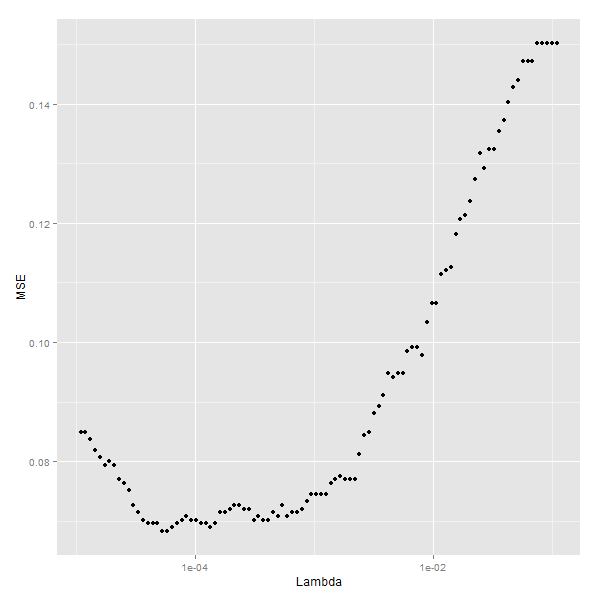
尝试不同的lambda参数,看看哪个更好
lambdas <- regularized.logit.fit$lambda

performance <- data.frame()

for (lambda in lambdas)
{
  predictions <- predict(regularized.logit.fit, test.x, s = lambda)
  predictions <- as.numeric(predictions > 0)
  mse <- mean(predictions != test.y)
  performance <- rbind(performance, data.frame(Lambda = lambda, MSE = mse))
}

ggplot(performance, aes(x = Lambda, y = MSE)) +
  geom_point() +
scale_x_log10()# Fourteenth code snippet
best.lambda <- with(performance, max(Lambda[which(MSE == min(MSE))]))
#[1] 5.788457e-05
# Fifteenth code snippet
mse <- with(subset(performance, Lambda == best.lambda), MSE)
mse
#[1] 0.06830769最优lambda值为5.788457e-05,最小的mse为[1] 5.788457e-05.
我们发现正则化的逻辑回归模型只有一个参数要进行调优,并且错误率只有6%.
SVM
这里的SVM只用初始参数
线性核函数SVM
# Sixteenth code snippet
library('e1071')
linear.svm.fit <- svm(train.x, train.y, kernel = 'linear')

# Seventeenth code snippet
predictions <- predict(linear.svm.fit, test.x)
predictions <- as.numeric(predictions > 0)

mse <- mean(predictions != test.y)

mse
#0.128
径向核函数SVM
# Eighteenth code snippet
radial.svm.fit <- svm(train.x, train.y, kernel = 'radial')

predictions <- predict(radial.svm.fit, test.x)
predictions <- as.numeric(predictions > 0)

mse <- mean(predictions != test.y)

mse
#[1] 0.1421538
我们发现径向核函数的效果比线性的还要差,这说明解决一个问题的最优模型取决于问题数据的内在结构.本例中,径向核函数表现不好,也许正意味着这个问题的边界可能是线性的.而逻辑回归比线模型SVM好也说明这个问题.
knn
适用于非线性数据的knn也来试试看
# Nineteenth code snippet
library('class')

knn.fit <- knn(train.x, test.x, train.y, k = 50)

predictions <- as.numeric(as.character(knn.fit))

mse <- mean(predictions != test.y)

mse
#[1] 0.1396923
k=5时误差率14%, 交叉验证看哪个k好
performance <- data.frame()

for (k in seq(5, 50, by = 5))
{
  knn.fit <- knn(train.x, test.x, train.y, k = k)
  predictions <- as.numeric(as.character(knn.fit))
  mse <- mean(predictions != test.y)
  performance <- rbind(performance, data.frame(K = k, MSE = mse))
}

best.k <- with(performance, K[which(MSE == min(MSE))])

best.mse <- with(subset(performance, K == best.k), MSE)

best.mse
#[1] 0.09169231
经过调优之后knn的误差率降到了9%,介于逻辑回归和svm之间.
经验
- 对于实际数据集, 应该尝试多个不同算法.
- 没有最优的算法,最优只取决于实际问题
- 模型的效果一方面取决于真是的数据结构,另一方面也取决于你为模型的参数调优所付出的努力.
