Numpy&Pandas学习总结
文章目录
- Numpy基础
-
- numpy的array创建
- numpy属性
- numpy的基础运算
- numpy的索引
- numpy的array合并
- numpy的array分割
- numpy的拷贝与深拷贝
- Pandas基础
-
- DataFrame基本介绍
- pandas选择数据
- pandas设置值
- pandas处理丢失数据
- pandas导入导出
- pandas合并concat
- pandas合并merge
- pandas画图plot
Numpy基础
numpy的array创建
import numpy as np
a = np.array([1,2,3])   # [1, 2, 3]
a = np.array([[1,  2],  [3,  4]])

# dtype
a = np.array([1,  2,  3], dtype = float)
numpy属性
# ndim shape size
a = np.array([[1,2,3],[4,5,6]])
print (a.ndim)      # 2
print (a.shape)     # (2, 3)
print (a.size)      # 6

# reshape
b = a.reshape(3,2)
# [[1 2]
#  [3 4]
#  [5 6]]
a=np.arange(12).reshape((3,4))
# [[ 0  1  2  3]
#  [ 4  5  6  7]
#  [ 8  9 10 11]]

# linspace
a=np.linspace(1,10,5)
# [ 1.    3.25  5.5   7.75  10.  ]
numpy的基础运算
a = np.array([10,20,30])
b = np.arange(3)
c = a-b     # [10 19 28]
c = b**2    # [0 1 4]
c = 10*np.sin(a)   # [-5.44021111  9.12945251 -9.88031624]
print(b<2)  # [ True  True  False]
c = a*b         # 数值相乘

# dot
c = np.dot(a,b) # 矩阵相乘
c = a.dot(b)

# random
c = np.random.random((1,2))  # [[0.77461324 0.73686157]]

# sum min max axis
np.sum(a)   # 求和
np.min(a,axis=1)   # 在列中运算
np.max(a,axis=0)   # 在行中运算

# argmin argmax
a = np.arange(2,14).reshape(3,4)
# [[ 2  3  4  5]
#  [ 6  7  8  9]
#  [10 11 12 13]]
print(np.argmin(a))     # 最小值的索引 0
print(np.argmax(a))     # 最大值的索引 11

# mean median cumsum
print(np.mean(a))   # 平均值 等同于np.average(a)
print(a.mean())
print(np.median(a)) # 中位数
print(np.cumsum(a)) # 累加 [ 2  5  9 14 20 27 35 44 54 65 77 90]

# diff
print(np.diff(a))
# [[1 1 1]
#  [1 1 1]
#  [1 1 1]]

# nonzero
print(np.nonzero(a))
# (array([0, 0, 0, 0, 1, 1, 1, 1, 2, 2, 2, 2]), array([0, 1, 2, 3, 0, 1, 2, 3, 0, 1, 2, 3]))

# sort
a = np.arange(14,2,-1).reshape(3,4)
print(a)
# [[14 13 12 11]
#  [10  9  8  7]
#  [ 6  5  4  3]]
print(np.sort(a))
# [[11 12 13 14]
#  [ 7  8  9 10]
#  [ 3  4  5  6]]

# transpose
print(np.transpose(a)) # 转置矩阵
print(a.T)

# clip
print(np.clip(a,5,9))
# [[9 9 9 9]
#  [9 9 8 7]
#  [6 5 5 5]]
numpy的索引
a = np.arange(3,15).reshape(3,4)
# [[ 3  4  5  6]
#  [ 7  8  9 10]
#  [11 12 13 14]]
print(a[2])   # [11 12 13 14]
print(a[2][1])   # 12
print(a[2,1])
print(a[1,:]) # [ 7  8  9 10]
print(a[1,1:3])  # [8 9]
for x in a:
  print(x)  #逐行打印
for x in a.T:
  print(x)  #逐列打印

# flat
for x in a.flat:
  print(x)  #逐个打印
print(a.flatten()) # [ 3  4  5  6  7  8  9 10 11 12 13 14]
numpy的array合并
a = np.array([1,1,1])
b = np.array([2,2,2])
print(a.shape)    # (3,)
print(a.T.shape)  # (3,) 一维不改变
print(a[np.newaxis,:].shape) # (1, 3)
print(a[:,np.newaxis].shape) # (3, 1)

# vstack
print(np.vstack((a,b))) # 上下合并
# [[1 1 1]
#  [2 2 2]]

# hstack
print(np.hstack((a,b))) # 左右合并
# [1 1 1 2 2 2]

# concatenate
print(np.concatenate((a,b,b),axis=0))
# [1 1 1 2 2 2 2 2 2]
numpy的array分割
# split
a = np.arange(12).reshape((3,4))
print(a)
# [[ 0  1  2  3]
#  [ 4  5  6  7]
#  [ 8  9 10 11]]
print(np.split(a,2,axis=1)) # axis=1 表示对列进行操作
# [array([[0, 1],
#        [4, 5],
#        [8, 9]]), array([[ 2,  3],
#        [ 6,  7],
#        [10, 11]])]
print(np.split(a,3,axis=0)) # 横向均分成3部分
# [array([[0, 1, 2, 3]]), array([[4, 5, 6, 7]]), array([[ 8,  9, 10, 11]])]

# array_split
print(np.array_split(a,3,axis=1)) # 纵向分成3部分
# [array([[0, 1],
#        [4, 5],
#        [8, 9]]), array([[ 2],
#        [ 6],
#        [10]]), array([[ 3],
#        [ 7],
#        [11]])]
print(np.vsplit(a,3)) # 横向均分成3部分
print(np.hsplit(a,2)) # 横向均分成2部分
numpy的拷贝与深拷贝
a = np.arange(4)
print(a) # [0 1 2 3]
b=a
a[0]=5
print(a) # [5 1 2 3]
print(b) # [5 1 2 3]
print(b is a) # True
b=a.copy()
a[0]=5
print(b) # [0 1 2 3]
print(b is a) # False
Pandas基础
DataFrame基本介绍
import numpy as np
import pandas as pd
s = pd.Series([1,3,6,np.nan,44,1]) # 序列
print(s)
# 0     1.0
# 1     3.0
# 2     6.0
# 3     NaN
# 4    44.0
# 5     1.0
# dtype: float64
dates= pd.date_range('20200713',periods=6)
print(dates)
# DatetimeIndex(['2020-07-13', '2020-07-14', '2020-07-15', '2020-07-16',
#                '2020-07-17', '2020-07-18'],
#               dtype='datetime64[ns]', freq='D')
df = pd.DataFrame(np.random.randn(6,4),index=dates,columns=['a','b','c','d'])
print(df)
#                    a         b         c         d
# 2020-07-13  0.388863 -0.608913  1.749353  0.061047
# 2020-07-14  0.282084  0.489508  1.200999  0.290284
# 2020-07-15  1.056817  1.996520 -0.949814 -1.999452
# 2020-07-16 -0.858179 -0.422738  1.629874 -0.866620
# 2020-07-17 -0.075192 -1.691861  2.089265 -1.997765
# 2020-07-18  0.936046  1.039739 -0.169192 -0.586105
df2 = pd.DataFrame(np.arange(12).reshape(3,4))
print(df2)
#    0  1   2   3
# 0  0  1   2   3
# 1  4  5   6   7
# 2  8  9  10  11
df2 = pd.DataFrame({
     'A':1.,
      'B':pd.Timestamp('20200713'),
      'C':pd.Series(1,index=list(range(4)),dtype='float32'),
      'D':np.array([3]*4,dtype='int32'),
      'E':pd.Categorical(["test","train","test","train"]),
      'F':'foo'})
print(df2)
#      A          B    C  D      E    F
# 0  1.0 2020-07-13  1.0  3   test  foo
# 1  1.0 2020-07-13  1.0  3  train  foo
# 2  1.0 2020-07-13  1.0  3   test  foo
# 3  1.0 2020-07-13  1.0  3  train  foo
print(df2.dtypes)
# A           float64
# B    datetime64[ns]
# C           float32
# D             int32
# E          category
# F            object
# dtype: object
print(df2.index)
# Int64Index([0, 1, 2, 3], dtype='int64')
print(df2.columns)
# Index(['A', 'B', 'C', 'D', 'E', 'F'], dtype='object')
print(df2.values)
# [[1.0 Timestamp('2020-07-13 00:00:00') 1.0 3 'test' 'foo']
#  [1.0 Timestamp('2020-07-13 00:00:00') 1.0 3 'train' 'foo']
#  [1.0 Timestamp('2020-07-13 00:00:00') 1.0 3 'test' 'foo']
#  [1.0 Timestamp('2020-07-13 00:00:00') 1.0 3 'train' 'foo']]
print(df2.describe()) # 数值分析
print(df2.T) # 转置
print(df2.sort_index(axis=0,ascending=False)) # ascending=False为倒序
#      A          B    C  D      E    F
# 3  1.0 2020-07-13  1.0  3  train  foo
# 2  1.0 2020-07-13  1.0  3   test  foo
# 1  1.0 2020-07-13  1.0  3  train  foo
# 0  1.0 2020-07-13  1.0  3   test  foo
print(df2.sort_values(by='E'))
#      A          B    C  D      E    F
# 0  1.0 2020-07-13  1.0  3   test  foo
# 2  1.0 2020-07-13  1.0  3   test  foo
# 1  1.0 2020-07-13  1.0  3  train  foo
# 3  1.0 2020-07-13  1.0  3  train  foo
pandas选择数据
dates=pd.date_range('20200713',periods=6)
df=pd.DataFrame(np.arange(24).reshape(6,4),index=dates,columns=['A', 'B', 'C', 'D'])
print(df['A'])
print(df.A)
print(df['20200713':'20200715'])
#             A  B   C   D
# 2020-07-13  0  1   2   3
# 2020-07-14  4  5   6   7
# 2020-07-15  8  9  10  11
print(df.loc['20200714',['A','B']])
# A    4
# B    5
# Name: 2020-07-14 00:00:00, dtype: int64
print(df.iloc[3:5,1:3])
#              B   C
# 2020-07-16  13  14
# 2020-07-17  17  18
print(df.ix[:3,['A','C']]) # 最新版已删除ix
print(df[df.A<8])
#             A  B  C  D
# 2020-07-13  0  1  2  3
# 2020-07-14  4  5  6  7
pandas设置值
dates=pd.date_range('20200713',periods=6)
df=pd.DataFrame(np.arange(24).reshape(6,4),index=dates,columns=['A', 'B', 'C', 'D'])
df.loc['20200713','B']=2222
df.iloc[0,2]=1111
df.B[df.A>4]=0
df['F']=np.nan
df['E']=pd.Series([1,2,3,4,5,6],index=pd.date_range('20200713',periods=6))
print(df)
#              A     B     C   D
# 2020-07-13   0  2222  1111   3
# 2020-07-14   4     5     6   7
# 2020-07-15   8     0    10  11
# 2020-07-16  12     0    14  15
# 2020-07-17  16     0    18  19
# 2020-07-18  20     0    22  23
pandas处理丢失数据
dates=pd.date_range('20200713',periods=6)
df=pd.DataFrame(np.arange(24).reshape(6,4),index=dates,columns=['A', 'B', 'C', 'D'])
df.iloc[0,1]=np.nan
df.iloc[1,2]=np.nan
print(df)
#              A     B     C   D
# 2020-07-13   0   NaN   2.0   3
# 2020-07-14   4   5.0   NaN   7
# 2020-07-15   8   9.0  10.0  11
# 2020-07-16  12  13.0  14.0  15
# 2020-07-17  16  17.0  18.0  19
# 2020-07-18  20  21.0  22.0  23
print(df.dropna(axis=0,how='any')) # 清洗值 how={'any','all'}
             A     B     C   D
# 2020-07-15   8   9.0  10.0  11
# 2020-07-16  12  13.0  14.0  15
# 2020-07-17  16  17.0  18.0  19
# 2020-07-18  20  21.0  22.0  23
print(df.fillna(value=0)) # 填充补值
print(np.any(df.isnull())) # 检查空数据
pandas导入导出
常用格式:csv,excel,pickle
data=pd.read_csv('student.csv') # 读取
print(data)
#   Student ID\tname\tage\tgender
# 0       1100\tKelly\t22\tFemale
# 1         1101\tClo\t21\tFemale
# 2       1102\tTilly\t22\tFemale
# 3          1103\tTony\t24\tMale
# 4         1104\tDavid\t20\tMale
data.to_pickle('student.pickle') # 保存,生成student.pickle文件
pandas合并concat
# ignore_index
df1=pd.DataFrame(np.ones((3,4))*0,columns=['a','b','c','d'])
df2=pd.DataFrame(np.ones((3,4))*1,columns=['a','b','c','d'])
df3=pd.DataFrame(np.ones((3,4))*2,columns=['a','b','c','d'])
print(df1)
#      a    b    c    d
# 0  0.0  0.0  0.0  0.0
# 1  0.0  0.0  0.0  0.0
print(df2)
#      a    b    c    d
# 0  1.0  1.0  1.0  1.0
# 1  1.0  1.0  1.0  1.0
print(pd.concat([df1,df2,df3],axis=0,ignore_index=True)) # ignore_index=True重新排序
#      a    b    c    d
# 0  0.0  0.0  0.0  0.0
# 1  0.0  0.0  0.0  0.0
# 2  1.0  1.0  1.0  1.0
# 3  1.0  1.0  1.0  1.0
# 4  2.0  2.0  2.0  2.0
# 5  2.0  2.0  2.0  2.0

# join
df1=pd.DataFrame(np.ones((3,4))*0,columns=['a','b','c','d'],index=[1,2,3])
df2=pd.DataFrame(np.ones((3,4))*1,columns=['b','c','d','e'],index=[2,3,4])
print(pd.concat([df1,df2])) # 默认join='outer'
#      a    b    c    d    e
# 1  0.0  0.0  0.0  0.0  NaN
# 2  0.0  0.0  0.0  0.0  NaN
# 3  0.0  0.0  0.0  0.0  NaN
# 2  NaN  1.0  1.0  1.0  1.0
# 3  NaN  1.0  1.0  1.0  1.0
# 4  NaN  1.0  1.0  1.0  1.0
print(pd.concat([df1,df2],join='inner'))
#      b    c    d
# 1  0.0  0.0  0.0
# 2  0.0  0.0  0.0
# 3  0.0  0.0  0.0
# 2  1.0  1.0  1.0
# 3  1.0  1.0  1.0
# 4  1.0  1.0  1.0

# axis
print(pd.concat([df1,df2],axis=1))
#      a    b    c    d    b    c    d    e
# 1  0.0  0.0  0.0  0.0  NaN  NaN  NaN  NaN
# 2  0.0  0.0  0.0  0.0  1.0  1.0  1.0  1.0
# 3  0.0  0.0  0.0  0.0  1.0  1.0  1.0  1.0
# 4  NaN  NaN  NaN  NaN  1.0  1.0  1.0  1.0

# append
print(df1.append(s1,ignore_index=True))
#      a    b    c    d
# 0  0.0  0.0  0.0  0.0
# 1  0.0  0.0  0.0  0.0
# 2  0.0  0.0  0.0  0.0
# 3  1.0  2.0  3.0  4.0
pandas合并merge
# on
left = pd.DataFrame({
     'key':['K0','K1','K2','K3'],
                    'A':['A0','A1','A2','A3'],
                    'B':['B0','B1','B2','B3']})
right = pd.DataFrame({
     'key':['K0','K1','K2','K3'],
                    'C':['C0','C1','C2','C3'],
                    'D':['D0','D1','D2','D3']})
print(left)
#   key   A   B
# 0  K0  A0  B0
# 1  K1  A1  B1
# 2  K2  A2  B2
# 3  K3  A3  B3
print(right)
#   key   C   D
# 0  K0  C0  D0
# 1  K1  C1  D1
# 2  K2  C2  D2
# 3  K3  C3  D3
print(pd.merge(left,right,on='key'))
#   key   A   B   C   D
# 0  K0  A0  B0  C0  D0
# 1  K1  A1  B1  C1  D1
# 2  K2  A2  B2  C2  D2
# 3  K3  A3  B3  C3  D3

# how
left = pd.DataFrame({
     'key1':['K0','K0','K1','K2'],
                    'key2':['K0','K1','K0','K1'],
                    'A':['A0','A1','A2','A3'],
                    'B':['B0','B1','B2','B3']})
right = pd.DataFrame({
     'key1':['K0','K1','K1','K2'],
                    'key2':['K0','K0','K0','K0'],
                    'C':['C0','C1','C2','C3'],
                    'D':['D0','D1','D2','D3']})
print(left)
#   key1 key2   A   B
# 0   K0   K0  A0  B0
# 1   K0   K1  A1  B1
# 2   K1   K0  A2  B2
# 3   K2   K1  A3  B3
print(right)
#   key1 key2   C   D
# 0   K0   K0  C0  D0
# 1   K1   K0  C1  D1
# 2   K1   K0  C2  D2
# 3   K2   K0  C3  D3
print(pd.merge(left,right,on=['key1','key2'])) #默认inner how={'left','right','inner','outer'}
#   key1 key2   A   B   C   D
# 0   K0   K0  A0  B0  C0  D0
# 1   K1   K0  A2  B2  C1  D1
# 2   K1   K0  A2  B2  C2  D2
print(pd.merge(left,right,on=['key1','key2'],how='left'))
#   key1 key2   A   B    C    D
# 0   K0   K0  A0  B0   C0   D0
# 1   K0   K1  A1  B1  NaN  NaN
# 2   K1   K0  A2  B2   C1   D1
# 3   K1   K0  A2  B2   C2   D2
# 4   K2   K1  A3  B3  NaN  NaN
print(pd.merge(left,right,on=['key1','key2'],how='right'))
#   key1 key2    A    B   C   D
# 0   K0   K0   A0   B0  C0  D0
# 1   K1   K0   A2   B2  C1  D1
# 2   K1   K0   A2   B2  C2  D2
# 3   K2   K0  NaN  NaN  C3  D3
print(pd.merge(left,right,on=['key1','key2'],how='outer'))
#   key1 key2    A    B    C    D
# 0   K0   K0   A0   B0   C0   D0
# 1   K0   K1   A1   B1  NaN  NaN
# 2   K1   K0   A2   B2   C1   D1
# 3   K1   K0   A2   B2   C2   D2
# 4   K2   K1   A3   B3  NaN  NaN
# 5   K2   K0  NaN  NaN   C3   D3

# indicator
df1 = pd.DataFrame({
     'col1':[0,1],'col_left':['a','b']})
df2 = pd.DataFrame({
     'col1':[1,2,2],'col_right':[2,2,2]})
print(df1)
#    col1 col_left
# 0     0        a
# 1     1        b
print(df2)
#    col1  col_right
# 0     1          2
# 1     2          2
# 2     2          2
print(pd.merge(df1,df2,on='col1',how='outer',indicator=True)) # indicator=True显示合并数据来源
#    col1 col_left  col_right      _merge
# 0     0        a        NaN   left_only
# 1     1        b        2.0        both
# 2     2      NaN        2.0  right_only
# 3     2      NaN        2.0  right_only
print(pd.merge(df1,df2,on='col1',how='outer',indicator=False))
#    col1 col_left  col_right
# 0     0        a        NaN
# 1     1        b        2.0
# 2     2      NaN        2.0
# 3     2      NaN        2.0

# left_index
left = pd.DataFrame({
     'A': ['A0', 'A1', 'A2'],
'B': ['B0', 'B1', 'B2']},
index=['K0', 'K1', 'K2'])
right = pd.DataFrame({
     'C': ['C0', 'C2', 'C3'],
'D': ['D0', 'D2', 'D3']},
index=['K0', 'K2', 'K3'])
print(left)
#      A   B
# K0  A0  B0
# K1  A1  B1
# K2  A2  B2
print(right)
#      C   D
# K0  C0  D0
# K2  C2  D2
# K3  C3  D3
print(pd.merge(left,right,left_index=True,right_index=True,how='outer'))
#       A    B    C    D
# K0   A0   B0   C0   D0
# K1   A1   B1  NaN  NaN
# K2   A2   B2   C2   D2
# K3  NaN  NaN   C3   D3
print(pd.merge(left,right,left_index=True,right_index=True,how='inner'))
#      A   B   C   D
# K0  A0  B0  C0  D0
# K2  A2  B2  C2  D2

# suffixes
boys = pd.DataFrame({
     'k': ['K0', 'K1', 'K2'], 'age': [1, 2, 3]})
girls = pd.DataFrame({
     'k': ['K0', 'K0', 'K3'], 'age': [4, 5, 6]})
print(boys)
#     k  age
# 0  K0    1
# 1  K1    2
# 2  K2    3
print(girls)
#     k  age
# 0  K0    4
# 1  K0    5
# 2  K3    6
print(pd.merge(boys, girls, on='k', suffixes=['_boy', '_girl'], how='inner'))
#     k  age_boy  age_girl
# 0  K0        1         4
# 1  K0        1         5
pandas画图plot
import numpy as np
import pandas as pd
import matplotlib.pyplot as plt
# Series
data = pd.Series(np.random.randn(1000),index=np.arange(1000))
data = data.cumsum()
data.plot()
plt.show()data

# DataFrame
data = pd.DataFrame(np.random.randn(1000,4),index=np.arange(1000),columns=list('ABCD'))
data = data.cumsum()
data.plot()
plt.show()

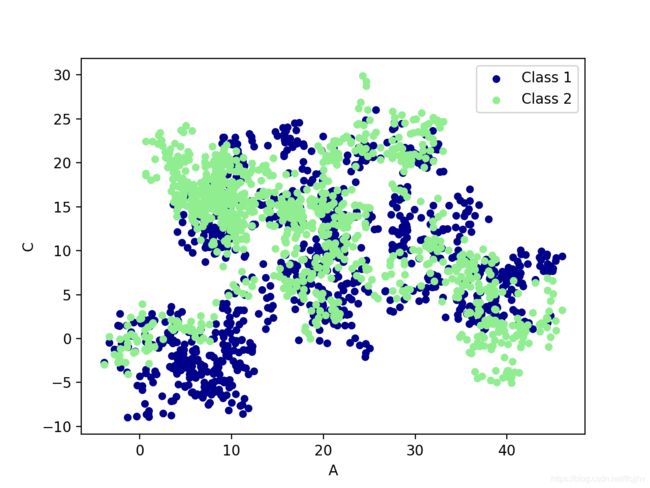
# 'bar','box','kde','area','scatter','hexbin','pie'
data = pd.DataFrame(np.random.randn(1000, 4), index=np.arange(1000), columns=list("ABCD"))
data = data.cumsum()
ax = data.plot.scatter(x='A', y='B', color='DarkBlue', label="Class 1")
data.plot.scatter(x='A', y='C', color='LightGreen', label='Class 2', ax=ax)
plt.show()
视频教程链接