k-means和EM算法的Matlab实现
说明:
1. 本文实现了K. P. Murphy的MLaPP一书第11章的k-means和GMM/EM算法;
2. Matlab代码;
3. 非职业码农,代码质量不高,变量命名也不规范,凑合着看吧,不好意思;
MLaPP书中说的很明白,k-means可以看做是GMM的一个特例。
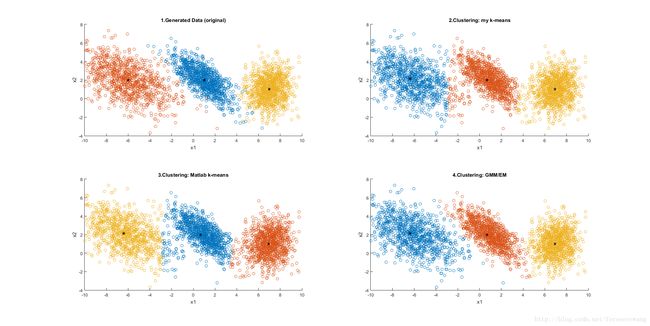
既然是特例,就有不适用的地方。本文构造出如图1所示的通用GMM数据,并分别用k-means(结果见图2和3)和EM聚类(结果见图4),可以看到k-means算法的局限性和GMM/EM算法的优势。
clear all;
close all;

%% Parameters
dim=[1000,2];   % 每簇的维度
Nclst=3;        % 簇的数量

len=dim(1)*Nclst;
k=dim(2);
mu=zeros(Nclst,k);
sigma=zeros(Nclst,k,k);
mu = [1 2; -6 2; 7 1];
sigma(1,:,:)=[2 -1.5; -1.5 2];
sigma(2,:,:)=[5 -2.; -2. 3];
sigma(3,:,:)=[1 0.1; 0.1 2];

%% Data Generation and display
z=zeros(len,k);     % 抽样生成的原始数据保存在z中
figure(1); subplot(2,2,1); hold on;
figure(2); hold on;
for ii=1:Nclst,
    z1=gaussample(mu(ii,:),squeeze(sigma(ii,:,:)),dim);
    figure(1); subplot(2,2,1);
    plot(z1(:,1),z1(:,2),'o');
    figure(2);
    plot(z1(:,1),z1(:,2),'o');
    z((ii-1)*dim(1)+1:ii*dim(1),:)=z1;
end;
figure(1); subplot(2,2,1);
plot(mu(:,1),mu(:,2),'k*');
axis([-10,10,-4,8]);
title('1.Generated Data (original)');
xlabel('x1');
ylabel('x2');

figure(2);
plot(mu(:,1),mu(:,2),'k*');
axis([-10,10,-4,8]);
title('Generated Data (original)');
xlabel('x1');
ylabel('x2');

z=z(randperm(len),:); % 随机化生成数据

%% clustering: my k-means

% 从生成的数据中随机抽选Nclst个作为初始聚类中心点
cent_init=round(rand(Nclst,1)*(len-1)+1);
center=z(cent_init,:);

dist=zeros(len,Nclst);      % 各点到聚类中心点的距离
for jj=1:20, % 简单起见,直接循环,不做结束判断
    for ii=1:Nclst, %计算距离(没开根号)
        dist(:,ii)=sum((z-repmat(center(ii,:),len,1)).^2,2);
    end;

    [dist_min,clst_idx]=min(dist,[],2);

    for ii=1:Nclst,
        idx=(clst_idx==ii);
        center(ii,:)=mean(z(idx,:));
    end;

end;

% display
figure(1); subplot(2,2,2); hold on;
for ii=1:Nclst,
    idx=(clst_idx==ii);
    plot(z(idx,1),z(idx,2),'o');
end;
plot(center(:,1),center(:,2),'k*');
axis([-10,10,-4,8]);
title('2.Clustering: my k-means');
xlabel('x1');
ylabel('x2');

%% clustering: Matlab k-means
k_idx=kmeans(z,Nclst); % Matlab有现成的k-means算法,so easy...
figure(1); subplot(2,2,3); hold on;
for ii=1:Nclst,
    idx=(k_idx==ii);
    plot(z(idx,1),z(idx,2),'o');
end;
plot(center(:,1),center(:,2),'k*');
axis([-10,10,-4,8]);
title('3.Clustering: Matlab k-means');
xlabel('x1');
ylabel('x2');

%% clustering: EM
% Refer to pp.351, MLaPP
% Pw: weight
% mu: u of Gaussion distribution
% sigma: Covariance matrix of Gaussion distribution
% r(i,k): responsibility; rk: sum of r over i
% px: p(x|mu,sigma)

% 上面的聚类结果作为EM算法的初始值
Pw=zeros(Nclst,1);
for ii=1:Nclst,
    idx=(clst_idx==ii);
    Pw(ii)=sum(idx)*1.0/len;
    mu(ii,:)=mean(z(idx,:));
    sigma(ii,:,:)=cov(z(idx,1),z(idx,2));
end;

px=zeros(len,Nclst);
r=zeros(len,Nclst);
for jj=1:20, % 简单起见,直接循环,不做结束判断
    for ii=1:Nclst,
        px(:,ii)=mvnpdf(z,mu(ii,:),squeeze(sigma(ii,:,:)));
    end;

    % E step
    temp=px.*repmat(Pw',len,1);
    r=temp./repmat(sum(temp,2),1,Nclst);

    % M step
    rk=sum(r);
    pw=rk/len;
    mu=r'*z./repmat(rk',1,k);
    for ii=1:Nclst
        sigma(ii,:,:)=z'*(repmat(r(:,ii),1,k).*z)/rk(ii)-mu(ii,:)'*mu(ii,:);
    end;
end;

% display
[dist_min,clst_idx]=max(px,[],2);
figure(1); subplot(2,2,4); hold on;
for ii=1:Nclst,
    idx=(clst_idx==ii);
    plot(z(idx,1),z(idx,2),'o');
end;
plot(center(:,1),center(:,2),'k*');
axis([-10,10,-4,8]);
title('4.Clustering: GMM/EM');
xlabel('x1');
ylabel('x2');
