Python进阶——绘制饼状图
Python进阶——绘制饼状图
代码需求
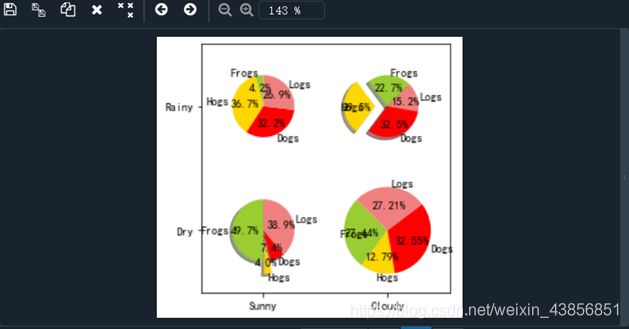
绘制饼状图
代码实现
# -*- coding: utf-8 -*-
import numpy as np
import matplotlib.pyplot as plt


labels = 'Frogs', 'Hogs', 'Dogs', 'Logs'
colors = ['yellowgreen', 'gold', '#FF0000', 'lightcoral'] # 'lawngreen', 'c', 'lightskyblue'

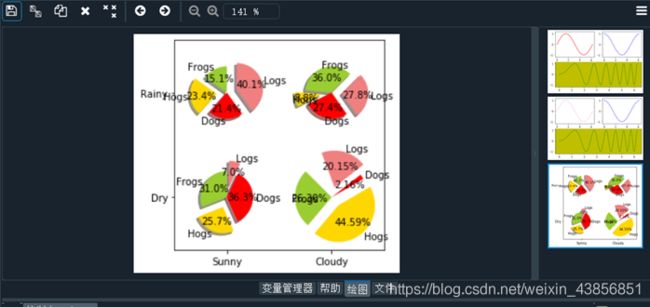
explode1 = (0, 0.1, 0, 0)              #设置突出显示的内容(使饼状图中第2片裂开)
explode2 = (0, 0, 0, 0)

fig = plt.figure()
ax = fig.gca() #当前的子图可以使用plt.gca()获得,然后再调用ax.pie()方法实现真正的绘图。

ax.pie(np.random.random(4), explode=explode1, labels=labels, colors=colors,
       autopct='%1.1f%%', shadow=True, startangle=90,
       radius=0.25, center=(0, 0), frame=True)   # autopct设置饼内百分比的格式, frame如果是true,绘制带有表的轴框架。
ax.pie(np.random.random(4), explode=explode1, labels=labels, colors=colors,
       autopct='%1.1f%%', shadow=True, startangle=45,
       radius=0.25, center=(1, 1), frame=True)
ax.pie(np.random.random(4), explode=explode2, labels=labels, colors=colors,
       autopct='%1.1f%%', shadow=False, startangle=90,
       radius=0.25, center=(0, 1), frame=True)
ax.pie(np.random.random(4), explode=explode2, labels=labels, colors=colors,
       autopct='%1.2f%%', shadow=False, startangle=135,
       radius=0.35, center=(1, 0), frame=True)


ax.set_xticks([0, 1])                    # 设置坐标轴刻度
ax.set_yticks([0, 1])

ax.set_xticklabels(["Sunny", "Cloudy"])  # 设置坐标轴刻度上的标签
ax.set_yticklabels(["Dry", "Rainy"])

ax.set_xlim((-0.5, 1.5))                 # 设置坐标轴跨度
ax.set_ylim((-0.5, 1.5))

ax.set_aspect('equal')                   # 设置x轴和y轴等长,否则饼图将不是一个正圆

plt.show()

