Pandas基础入门(一)
一、Pandas是什么?
Pandas是Python的一个开源数据分析库,可以说是是目前Python数据分析必备神器之一,在机器学习任务中,我们首先需要对数据进行清洗和编辑等工作,pandas库大大简化了我们的工作量,熟练并掌握pandas常规用法是正确构建机器学习模型的第一步。它能够处理类似电子表格的数据,用于快速数据加载,操作,对齐,合并,数据预处理等。
二、实验环境说明
- python3.6.4
- IDE:Pycharm 2018(很好用,python的web开发神器)
- 操作系统:windows10
- 实验源数据下载
三、Pandas库的安装
- 1、通过Anaconda安装,最简单的方法不是直接安装Pandas,而是安装Python和构成SciPy数据科学技术栈的最流行的工具包(IPython,NumPy,Matplotlib,…)的集合Anaconda。
- 2、Conda是Anaconda发行版所基于的软件包管理器,利用Conda软件包工具来安装。
conda install Pandas
- 3、通过pip软件包管理工具安装
pip insatall Pandas
!相关的依赖库可以在用到的时候在进行安装,推荐安装numexpr,bottleneck可以用于加速运算
四、Pandas概述
3.1 Pandas的基本功能
- 1、强大的IO接口工具,用于从平面文件(CSV和分隔)、Excel文件、数据库中保存或加载数据,数据文件的导入和导出。
- 2、浮点和非浮点数据中轻松处理缺失数据(表示为NaN)。
- 3、可以从DataFrame和更高维度的对象中插入和删除。
- 4、基于智能标签的切片,花式索引和子集大数据集,这里的数据表切片索引类似于matlab中的操作
- 5、直观的合并加入数据集。
- 6、 特定的时间序列数据集生成功能。
3.2 Pandas的数据类型
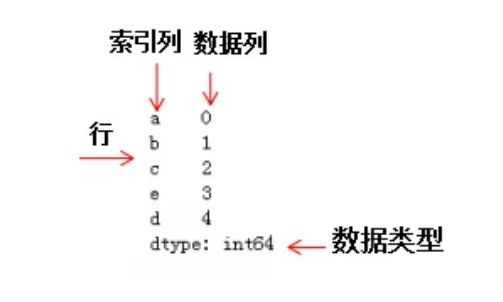
1、 pandas包含两种数据类型:series和dataframe。
2、其中series是一种一维数据结构,与一维数组的含义相似,其中索引可以为数字或字符串,series结构如下图:

3、dataframe是一种二维数据结构,数据以表格形式(与excel类似)存储,有对应的行和列。类似于matlab中的矩阵。dataframe结构如图:

3.3 导入库查看版本号
import xlrd
import numpy as np
import pandas as pd
print(pd.__version__)
五、Pandas入门常用
4.1 数据文件的导入导出(包括了csv,excel等文件)
#读入大车的单车源强数据
df = pd.read_excel('C:/Users/13109/desktop/单车源强数据2.xlsx','大车',na_vlues=['NA'])
print(df)
#导出大车的单车源强数据
df.to_csv('C:/Users/13109/desktop/单车源强数据.csv',encoding="gb2312")
df.to_excel('C:/Users/13109/desktop/单车源强数据3.xlsx',sheet_name='大车')
打印输出结果:
(noise_data) D:\CloudMusic\virtualenv\noise_data\traffic_noise>python test.py
      id number plate  ...  Radar speed (km/h)  Number of axes
0      1          976  ...                  75             3.0
1      2          471  ...                  69             2.0
2      3          285  ...                  68             3.0
3      4          168  ...                  64             3.0
4      5          318  ...                  50             3.0
..   ...          ...  ...                 ...             ...
893  894      754挂560  ...                  67             5.0
894  895      881挂585  ...                  64             4.0
895  896          453  ...                  65             4.0
896  897          356  ...                  67             2.0
897  898          400  ...                  55             4.0

[898 rows x 7 columns]
4.2 数据预览(查看)
- 查看DataFrame顶部和尾部的数据:
#读入大车的单车源强数据
df = pd.read_excel('C:/Users/13109/desktop/单车源强数据2.xlsx','大车',na_vlues=['NA'])
# print(df)
print(df.head(5))
print(df.tail(5))

# 输出
      id number plate  ...  Radar speed (km/h)  Number of axes
893  894      754挂560  ...                  67             5.0
894  895      881挂585  ...                  64             4.0
895  896          453  ...                  65             4.0
896  897          356  ...                  67             2.0
897  898          400  ...                  55             4.0

[5 rows x 7 columns]
- 显示数据帧长度,索引、列和底层NumPy数据:
print(len(df))
print(df.index) #行索引
print(df.columns) #列索引
print(df.values) #查看内容,不带行列索引
print(df.to_numpy())#将数据帧强制转换成一个底层的NumPy对象

#输出如下
(noise_data) D:\CloudMusic\virtualenv\noise_data\traffic_noise>python test.py
898
RangeIndex(start=0, stop=898, step=1)
Index(['id', 'number plate', 'Sound pressure level 1 (dBA)',
       'Sound pressure level 2 (dBA)', 'Rear speed (km/h)',
       'Radar speed (km/h)', 'Number of axes'],
      dtype='object')
[[1 976 92.8 ... 79.7 75 3.0]
 [2 471 93.9 ... 66.7 69 2.0]
 [3 285 91.2 ... 63.6 68 3.0]
 ...
 [896 453 87.0 ... 65.0 65 4.0]
 [897 356 81.6 ... 67.0 67 2.0]
 [898 400 86.3 ... 55.0 55 4.0]]
[[1 976 92.8 ... 79.7 75 3.0]
 [2 471 93.9 ... 66.7 69 2.0]
 [3 285 91.2 ... 63.6 68 3.0]
 ...
 [896 453 87.0 ... 65.0 65 4.0]
 [897 356 81.6 ... 67.0 67 2.0]
 [898 400 86.3 ... 55.0 55 4.0]]
- describe() 方法显示数据的快速统计摘要:
a=df.describe()
print(a)
a.to_csv('C:/Users/13109/desktop/大车描述统计.csv',encoding="gb2312")

# 打印输出描述性统计结果并保存到桌面csv文件
- 转置以及排序
print(df.T) #转置
# print(df.sort_index(axis=1, ascending=False)) #按轴排序

print(df.sort_values(by='Radar speed (km/h)'))  # 按照某一列数据,从小到大排序,类似于excel
4.3 数据的索引选择
!对于生产环境的代码,我们推荐优化的Pandas数据访问方法.at、.iat、.loc和.iloc
- 常规索引,按行切片,按列获取
print(df['Radar speed (km/h)'])#按照列获取一个“Series”
print(df[100:103])#按照进行切片

#打印输出
0      75
1      69
2      68
3      64
4      50
       ..
893    67
894    64
895    65
896    67
897    55
Name: Radar speed (km/h), Length: 898, dtype: int64
      id number plate  ...  Radar speed (km/h)  Number of axes
100  101          722  ...                  84             3.0
101  102          960  ...                  54             4.0
102  103          613  ...                  61             4.0

[3 rows x 7 columns]
- 按照标签进行索引,用到.loc方法,这里的标签可以理解为行索引数据(我觉得这种方法不好用);
# 选取多个列的所有数据
print(df.loc[:,['number plate','Number of axes']])
# 横纵坐标按照标签同时进行切片
print(df.loc[102:202,['number plate']])

#打印输出
(noise_data) D:\CloudMusic\virtualenv\noise_data\traffic_noise>python test.py
    number plate  Number of axes
0            976             3.0
1            471             2.0
2            285             3.0
3            168             3.0
4            318             3.0
..           ...             ...
893      754挂560             5.0
894      881挂585             4.0
895          453             4.0
896          356             2.0
897          400             4.0

[898 rows x 2 columns]
    number plate
102          613
103          328
104        17386
105          878
106        55615
107          265
!下面介绍的iloc()更加实用,类似于matlab语法
- 按照位置进行索引,使用.iloc()方法,该方法是纯粹基于数字的索引,类似于matlab中的矩阵操作
#切片一行数据
print(df.iloc[3])

# 按位置选择,横纵坐标同时切片
print(df.iloc[3:6,0:3])

# 随意选取行号和列号进行切片
print(df.iloc[[1,2,4],[0,2,3]])

# 整行切片
print(df.iloc[:,0:4])

# 整列切片
print(df.iloc[100:103,:])

# # 获取具体值以及快速访问
print(df.iloc[1,1])
print(df.iat[1,1])

#########打印输出结果#########
(noise_data) D:\CloudMusic\virtualenv\noise_data\traffic_noise>python test.py
id                                 4
number plate                     168
Sound pressure level 1 (dBA)    89.2
Sound pressure level 2 (dBA)    87.2
Rear speed (km/h)               63.6
Radar speed (km/h)                64
Number of axes                     3
Name: 3, dtype: object
   id number plate  Sound pressure level 1 (dBA)
3   4          168                          89.2
4   5          318                          84.2
5   6          923                          86.5
   id  Sound pressure level 1 (dBA)  Sound pressure level 2 (dBA)
1   2                          93.9                          96.2
2   3                          91.2                          94.4
4   5                          84.2                          84.1

[898 rows x 4 columns]
      id number plate  ...  Radar speed (km/h)  Number of axes
100  101          722  ...                  84             3.0
101  102          960  ...                  54             4.0
102  103          613  ...                  61             4.0

[3 rows x 7 columns]
471
471
- 布尔索引相关
# 布尔索引轴数为3的数据帧
print(df[df.Number_of_axes ==3])

#打印输出结果
      id number plate  ...  Radar speed (km/h)  Number_of_axes
0      1          976  ...                  75             3.0
2      3          285  ...                  68             3.0
3      4          168  ...                  64             3.0
4      5          318  ...                  50             3.0
8      9          967  ...                  71             3.0
..   ...          ...  ...                 ...             ...
847  848          457  ...                  79             3.0
855  856          203  ...                  58             3.0
872  873           51  ...                  66             3.0
873  874          882  ...                  58             3.0
874  875      476挂778  ...                  80             3.0

[128 rows x 7 columns]
- 索引赋值操作
#添加新列,根据index索引对齐数据
s1 = pd.Series(pd.date_range('2019-07-25',periods=len(df)))
df['新插'] = s1
df = df.iloc[10:200,6:8]
print(df)

#通过numpy数组进行赋值
df.loc[:,'新插'] = np.array([5]*len(df))
print(df)

##上述代码的打印输出结果
     Number_of_axes         新插
10              4.0 2019-08-04
11              6.0 2019-08-05
12              6.0 2019-08-06
13              2.0 2019-08-07
14              4.0 2019-08-08
..              ...        ...
195             2.0 2020-02-05
196             6.0 2020-02-06
197             4.0 2020-02-07
198             3.0 2020-02-08
199             3.0 2020-02-09

[190 rows x 2 columns]
     Number_of_axes  新插
10              4.0   5
11              6.0   5
12              6.0   5
13              2.0   5
14              4.0   5
..              ...  ..
195             2.0   5
196             6.0   5
197             4.0   5
198             3.0   5
199             3.0   5

[190 rows x 2 columns]
!未完待续,下一篇文章继续介绍Pandas的基本用法
本文参考的文章教程
- Pandas中文网、Pandas官方中文文档
- Pandas官方英文文档
