计算机视觉特征点检测(4) —— HOG特征描述算子
计算机视觉特征点检测(4) —— HOG特征描述算子
- HOG特征介绍
- HOG处理步骤
-
- 图像预处理
- 计算图像梯度
- 计算梯度直方图
- Block归一化
- 基于OpenCV的实现
HOG特征介绍
HOG(Histogram of Oriented Gradients —— 方向梯度直方图)特征是一种图像局部特征,其基本思路是对图像局部的梯度幅值和方向进行投票统计,形成基于梯度特性的直方图,然后将局部特征拼接起来作为总特征。
HOG+SVM的工作流程图如下:
![]()
首先对输入的图片进行预处理,然后计算像素点的梯度特性,包括梯度幅值和梯度方向。然后投票统计形成梯度直方图,然后对blocks进行normalize,最后收集到HOG feature,放到SVM里进行监督学习,从而实现行人的检测。
HOG处理步骤
图像预处理
预处理包括灰度化和Gamma变换。
伽马矫正是调节图像的对比度,减少光照对图像的影响(包括光照不均和局部阴影),使过曝或者欠曝的图像恢复正常,更接近人眼看到的图像。
伽马矫正公式:
f ( I ) = I γ f(I) = I^{\gamma } f(I)=Iγ
import cv2
import numpy as np
from matplotlib import pyplot as plt
img = cv2.imread('*.png', 0)
img = cv2.cvtColor(img,cv2.COLOR_BGR2RGB)
img2 = np.power(img/float(np.max(img)),1/2.2)
plt.imshow(img2)
plt.axis('off')
plt.show()
计算图像梯度
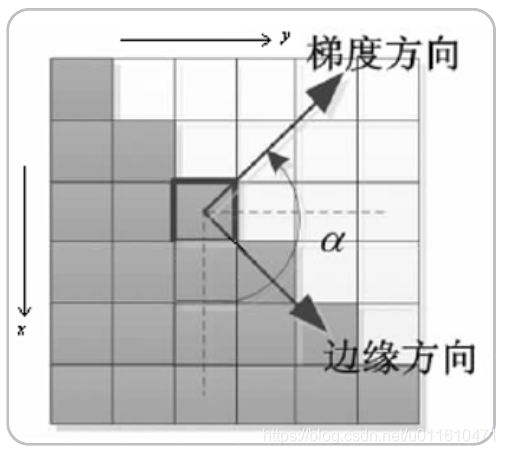
为了得到梯度直方图,那么首先需要计算图像水平方向和垂直方向梯度。一般使用特定的卷积核对图像滤波实现,可选用的卷积模板有:soble算子、Prewitt算子、Roberts等。
soble算子:
S o b e l X = [ 1 0 − 1 ] ∗ [ 1 2 1 ] = [ 1 2 1 0 0 0 − 1 − 2 − 1 ] S o b e l Y = [ 1 2 1 ] ∗ [ 1 0 − 1 ] = [ 1 0 − 1 2 0 − 2 1 0 − 1 ] d x = f ( x , y ) ∗ S o b e l x ( x , y ) d y = f ( x , y ) ∗ S o b e l y ( x , y ) Sobel_X=\begin{bmatrix} 1\\ 0\\ -1 \end{bmatrix} \ast \begin{bmatrix} 1&2&1 \end{bmatrix} = \begin{bmatrix} 1 & 2 & 1\\ 0 & 0 & 0\\ -1 &-2 &-1 \end{bmatrix} \\ Sobel_Y=\begin{bmatrix} 1\\ 2\\ 1 \end{bmatrix} \ast \begin{bmatrix} 1 & 0& -1 \end{bmatrix} = \begin{bmatrix} 1 & 0 & -1\\ 2 & 0 & -2\\ 1 & 0 & -1 \end{bmatrix} \\ d_x = f(x,y) * Sobel_x(x,y) \\ d_y = f(x,y) * Sobel_y(x,y) SobelX=⎣⎡10−1⎦⎤∗[121]=⎣⎡10−120−210−1⎦⎤SobelY=⎣⎡121⎦⎤∗[10−1]=⎣⎡121000−1−2−1⎦⎤dx=f(x,y)∗Sobelx(x,y)dy=f(x,y)∗Sobely(x,y)
进一步可以得到图像梯度的幅值:
M ( x , y ) = d x 2 ( x , y ) + d y 2 ( x , y ) M(x,y) = \sqrt{d_x^2(x,y) + d_y^2(x,y)} M(x,y)=dx2(x,y)+dy2(x,y)
为了简化,幅值也可以作如下近似:
M ( x , y ) = ∣ d x ( x , y ) ∣ + ∣ d y ( x , y ) ∣ M(x,y) = |d_x(x,y)| + |d_y(x,y)| M(x,y)=∣dx(x,y)∣+∣dy(x,y)∣
角度为
θ M = a r c t a n ( d y d x ) \theta _M = arctan(\frac{d_y}{d_x}) θM=arctan(dxdy)

mport cv2
import numpy as np
•
# Read image
img = cv2.imread('*.jpg')
img = np.float32(img) / 255.0 # 归⼀一化
•
# 计算x和y⽅方向的梯度
gx = cv2.Sobel(img, cv2.CV_32F, 1, 0, ksize=1)
gy = cv2.Sobel(img, cv2.CV_32F, 0, 1, ksize=1)
•
# 计算合梯度的幅值和⽅方向(⻆角度)
mag, angle = cv2.cartToPolar(gx, gy, angleInDegrees=True)
计算梯度直方图

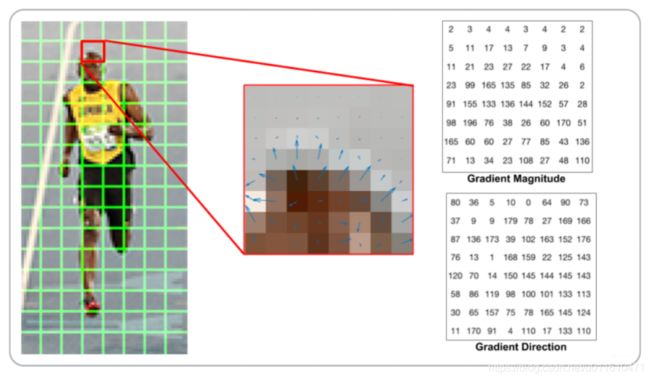
左图是一副64128的图像,被划分为816个88的cell,中间的图像表示一个cell中的梯度矢量,箭头朝向代表梯度方向,箭头长度代表梯度大小。
右图是88的cell中表示梯度的原始数值,角度为“无符号”梯度,在0-180度之间。
将0-180度分成9等分,称为9个bins,然后对每个bin中梯度的贡献进行统计:

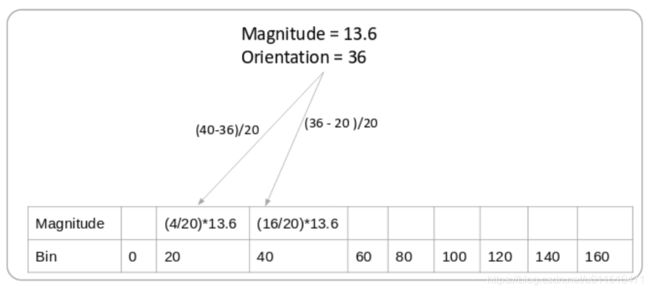
统计方法是加权投票统计,如上图所示,某像素的梯度幅值为13.6,方向为36,36度两侧的角度bin分别为20度和40度,那么就按一定加权比例分别在20度和40度对应的bin加上梯度值:
20度对应的bin: ( ( 40 − 36 ) / 20 ) ∗ 13.6 ((40-36)/20)*13.6 ((40−36)/20)∗13.6,分母的20表示20等份;
40度对应的bin: ( ( 36 − 20 ) / 20 ) ∗ 13.6 ((36-20)/20)*13.6 ((36−20)/20)∗13.6,分母的20表示20等份;

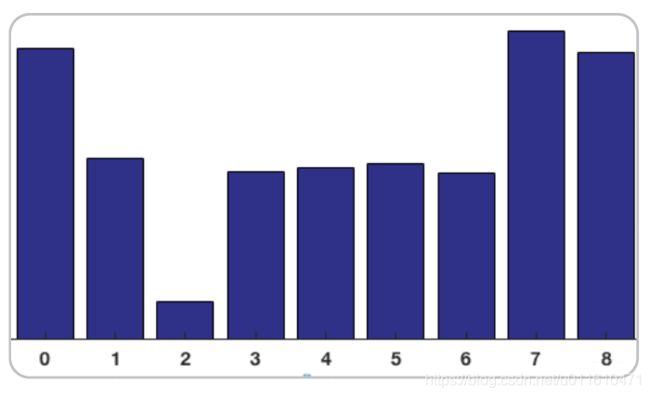
对整个cell进行投票统计,即得到由9个数组组成的向量-梯度方向图:

Block归一化
HOG特征将88的一个局部区域作为一个cell,再以22个cell作为一组,称为一个block。
这里采用L2-norm作为归一化的方法。
基于OpenCV的实现
import cv2 as cv
import numpy as np
from matplotlib import pyplot as plt
if __name__ == '__main__':
src = cv.imread("*.jpg")
cv.imshow("input", src)
hog = cv.HOGDescriptor()
hog.setSVMDetector(cv.HOGDescriptor_getDefaultPeopleDetector())
# Detect people in the image
(rects, weights) = hog.detectMultiScale(src,
winStride=(2,4),
padding=(8, 8),
scale=1.2,
useMeanshiftGrouping=False)
for (x, y, w, h) in rects:
cv.rectangle(src, (x, y), (x + w, y + h), (0, 255, 0), 2)
cv.imshow("hog-detector", src)
cv.imwrite("hog-detector.jpg",src)
cv.waitKey(0)
cv.destroyAllWindows()
可视化
from skimage import feature, exposure
from matplotlib import pyplot as plt
import cv2
image = cv2.imread('sp_g.jpg')
image = cv2.cvtColor(image, cv2.COLOR_BGR2GRAY)
fd, hog_image = feature.hog(image, orientations=9, pixels_per_cell=(8, 8), cells_per_block=(2, 4), visualise=True)
# Rescale histogram for better display
hog_image_rescaled = exposure.rescale_intensity(hog_image, in_range=(0, 10))
cv2.namedWindow("img",cv2.WINDOW_NORMAL)
cv2.imshow('img', image)
cv2.namedWindow("hog",cv2.WINDOW_NORMAL)
cv2.imshow('hog', hog_image_rescaled)
cv2.waitKey(0)==ord('q')