地理加权回归R语言实例
目录
- 数据准备
-
- 加载需要的R包
- 导入空间数据
- 空间自相关分析
-
- 空间邻域
-
- 面数据空间邻域
- 点数据空间邻域
- 全局空间自相关
- 局部空间自相关
- 空间回归分析
-
- 线性回归分析
- 地理加权回归
经典的线性回归模型是建立在最小二乘法 (OLS模型) 基础上对参数进行“平均”或“全局”估计。如果自变量为空间数据,且自变量间存在空间自相关性,传统回归模型(OLS模型)残差项独立的假设将无法满足。地理加权回归(GWR)模型能够反映参数在不同空间的空间非平稳性,使变量间的关系可以随空间位置的变化而变化,其结果更符合客观实际,能反映局部情况。
杨晴青,刘倩,尹莎,张戬,杨新军,高岩辉.秦巴山区乡村交通环境脆弱性及影响因素——以陕西省洛南县为例[J].地理学报,2019,74(06):1236-1251.
地理加权回归的软件平台有不少,如GWR,Arcgis等,武汉大学卢宾宾老师开发了GWmodel函数包,囊括了地理加权回归分析技术、混合地理加权回归分析模型、地理加权回归分析共线性纠偏、地理加权回归分析预测模型、地理加权汇总统计量、地理加权主成分分析、地理加权判别分析等地理加权建模技术,采用定量分析的手段分析空间数据关系异质性或非平稳性特征。
学习地理加权回归首先了解空间自相关和空间回归分析
数据准备
加载需要的R包
#library packages
library(rgeos)
library(maptools) #读取空间数据
library(spdep)  #用于空间自相关分析
library(RColorBrewer)
library(GWmodel) #地理加权回归包
library(gstat) #空间插值
library(raster) #栅格数据处理
导入空间数据
#import data
LNHP <- readShapePoints("Data/LNHP",verbose = T,proj4string = CRS("+init=epsg:27700"))
LN.bou <- readShapePoly("Data/LondonBorough",verbose = T,proj4string = CRS("+init=epsg:27700"))
空间自相关分析
在现实地理世界中,由于受到相邻地物之间交互作用和空间扩散作用的影响,空间对象彼此之间不是相互独立存在,而存在较强的空间依赖关系(spatial dependence)。
空间邻域
面数据空间邻域
在学习空间自相关分析技术之前需要了解空间邻域(Spatial Neighbours)的定义,它是空间自相关分析权重计算的基础,直接关系到空间自相关分析的最终结果。
函数包spdep提供了poly2nb函数生成多边形Queen邻域和Rook邻域
- 生成queen邻域
LN.bou.nbl <- poly2nb(LN.bou) #生成queen邻域
LN.bou.nbl
plot(LN.bou,border="lightgrey")
plot(LN.bou.nbl,coordinates(LN.bou),col="red",add=TRUE)
- 生成Rook邻域
LN.bou.nb2 <- poly2nb(LN.bou,queen = FALSE)  #生成Rook邻域
LN.bou.nb2
plot(LN.bou,border="lightgrey")
plot(LN.bou.nb2,coordinates(LN.bou),col="blue",add=TRUE)
点数据空间邻域
点数据的空间邻域是基于点位之间距离的定义,一般为k最近邻域(K nearest neighbours,KNN)。
- 生成k最近邻域
#点数据的空间邻域(KNN)
LNHPnb <- knn2nb(knearneigh(LNHP,k=4,longlat = TRUE)) #k最近邻域
LNHPnb_s <- make.sym.nb(LNHPnb)
plot(LNHP)
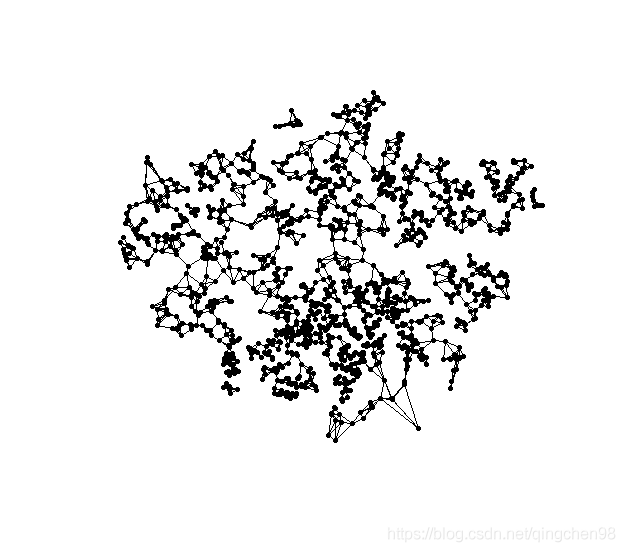
plot(nb2listw(LNHPnb_s),cbind(LNHP$X,LNHP$Y),pch=20)
#or
plot(nb2listw(LNHPnb_s),coordinates(LNHP),pch=20)
全局空间自相关
莫兰指数用于表征全局空间自相关程度,数值分布在[-1,1],[0,1]说明各地理实体之间存在正相关的关系,[-1,0]之间说明存在负相关的关系,而0值则无相关关系。
- 莫兰指数
###全局空间自相关
#莫兰指数
col.W <- nb2listw(LNHPnb_s,style = "W")
moi <- moran(LNHP$PURCHASE,col.W,length(LNHP$PURCHASE),Szero(col.W))
moi
$I
[1] 0.2925201

$K
[1] 11.94014
- 显著性检验
moran.test函数提供了随机检验和正太近似检验两种方法
#检验显著性
> moran_LNHP_ran <- moran.test(LNHP$PURCHASE,listw = nb2listw(LNHPnb_s))
> moran_LNHP_ran

	Moran I test under randomisation

data:  LNHP$PURCHASE
weights: nb2listw(LNHPnb_s)

Moran I statistic standard deviate = 18.507, p-value < 2.2e-16
alternative hypothesis: greater
sample estimates:
Moran I statistic       Expectation          Variance
     0.2925200768     -0.0006250000      0.0002508961

> moran_LNHP_Nor <- moran.test(LNHP$PURCHASE,listw = nb2listw(LNHPnb_s),
+                              randomisation = FALSE)
> moran_LNHP_Nor

	Moran I test under normality

data:  LNHP$PURCHASE
weights: nb2listw(LNHPnb_s)

Moran I statistic standard deviate = 18.455, p-value < 2.2e-16
alternative hypothesis: greater
sample estimates:
Moran I statistic       Expectation          Variance
     0.2925200768     -0.0006250000      0.0002523099
局部空间自相关
首先说明一下进行局部相关分析的必要性:
在全局相关分析中,如果全局莫兰指数显著,我们即可认为在该区域上存在空间相关性。但是,我们还是不知道具体在哪儿些地方存在着空间聚集现象。这个时候就需要局部莫兰指数参与帮助说明。
即使全局莫兰指数为0,在局部上也不一定就没有空间聚集现象!
- 计算局部莫兰指数
###局部空间自相关
#局部莫兰指数
local.mi <- localmoran(LNHP$PURCHASE,listw = nb2listw(LNHPnb_s,style = "W"))
local.mi
LNHP$local_mi <- local.mi[,1]
mypalette <- brewer.pal(5,"Blues")
LN_bou <- list("sp.polygons",LN.bou)
map.layout <- list(LN_bou)
spplot(LNHP,"local_mi",main="Local Moran's statistic",key.space="right",pch=16,
       cex=(LNHP$local_mi/max(LNHP$local_mi)+0.5)*2,col.regions=mypalette,
       cuts=6,sp.layout=map.layout)
- 绘制散点图
#绘制莫兰散点图
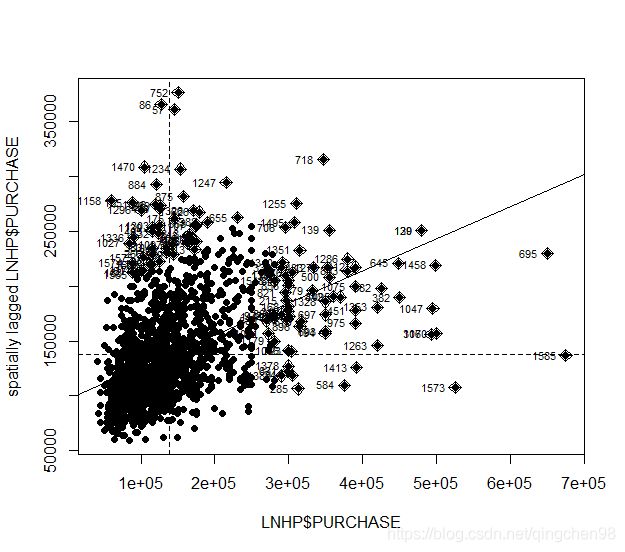
moran.plot(LNHP$PURCHASE,col.W,pch=19)
空间回归分析
在计量统计学中,回归分析技术是变量间关系定量分析的核心技术之一,也是多元数据分析的基础技术。
线性回归分析
- 简单线性回归
###空间回归分析
#线性回归
lm_LN <-lm(PURCHASE-FLOORSZ, data = LNHP)summary(Im_LN)
#绘制分析结果
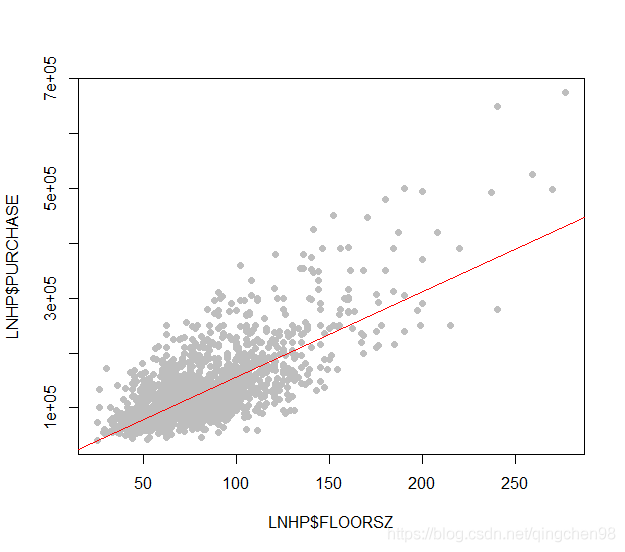
plot(LNHP $FLOORSZ, LNHP $PURCHASE, pch=16, col="grey")
abline (a=818.62,b=1552.39,col="red")
- 多元线性回归
#多元线性回归
> lm_LN.all <- lm(PURCHASE~FLOORSZ+TYPEDETCH+TYPEFLAT+BLDPWW1+BLDPOSTW+BLD70S+BLD90S+BATH2+PROF,data = LNHP)
> summary(lm_LN.all)

Call:
lm(formula = PURCHASE ~ FLOORSZ + TYPEDETCH + TYPEFLAT + BLDPWW1 +
    BLDPOSTW + BLD70S + BLD90S + BATH2 + PROF, data = LNHP)

Residuals:
    Min      1Q  Median      3Q     Max
-140884  -21408   -1291   17829  217777

Coefficients:
             Estimate Std. Error t value Pr(>|t|)
(Intercept) -70647.35    4871.64 -14.502  < 2e-16 ***
FLOORSZ       1334.71      40.26  33.151  < 2e-16 ***
TYPEDETCH    27613.01    5619.30   4.914 9.85e-07 ***
TYPEFLAT     -5341.05    2357.47  -2.266   0.0236 *
BLDPWW1      10912.29    2014.59   5.417 7.00e-08 ***
BLDPOSTW     -4130.31    3583.83  -1.152   0.2493
BLD70S      -15137.61    3814.05  -3.969 7.54e-05 ***
BLD90S       10073.03    5017.79   2.007   0.0449 *
BATH2        43496.90    4459.51   9.754  < 2e-16 ***
PROF          2420.32      85.66  28.255  < 2e-16 ***
---
Signif. codes:  0 ‘***’ 0.001 ‘**’ 0.01 ‘*’ 0.05 ‘.’ 0.1 ‘ ’ 1

Residual standard error: 35750 on 1591 degrees of freedom
Multiple R-squared:  0.7245,	Adjusted R-squared:  0.723
F-statistic:   465 on 9 and 1591 DF,  p-value: < 2.2e-16
地理加权回归
- 模型选择
以LNHP数据为例,因过多的自变量可能导致局部共线性问题,所以需要函数model.selection.gwr对模型进行优选。
DeVar <- "PURCHASE"
InDeVars <- c("FLOORSZ","TYPEDETCH","TYPEFLAT", "BLDPWW1","BLDPOSTW" ,"BLD60S","BLD70S","BLD80S",
              "BLD90S","BATH2","PROF")
model.sel <- model.selection.gwr(DeVar,InDeVars,data = LNHP,kernel = "gaussian",
                                 adaptive = TRUE,bw=10000000000000)
sorted.models <- model.sort.gwr(model.sel,numVars = length(InDeVars),
                                ruler.vector = model.sel[[2]][,2])
model.list <- sorted.models[[1]]
model.view.gwr(DeVar,InDeVars,model.list = model.list)
plot(sorted.models[[2]][,2],col="black",pch=20,lty=5,
     main="Alternative view of GWR model selection procedure",
     ylab="AICc value",xlab="Model number",type="b")

根据优选结果,一般选择AICc值区域平稳时(经验情况为变化小于3)的模型,即第60个模型(PURCHASE~FLOORSZ+PROF+BATH2+BLDPWW1+TYPEDETCH+BLD60S+BLD70S)。
- 带宽选择
选定模型后,利用bw.gwr函数进行带宽的自动选择
> #带宽选择的自动选择
> bw.gwr.1 <- bw.gwr(PURCHASE~FLOORSZ+PROF+BATH2+BLDPWW1+TYPEDETCH+BLD60S+BLD70S,
+                    data = LNHP,approach = "AICc",kernel = "gaussian",adaptive = TRUE)
Take a cup of tea and have a break, it will take a few minutes.
          -----A kind suggestion from GWmodel development group
Adaptive bandwidth (number of nearest neighbours): 997 AICc value: 38036.72
Adaptive bandwidth (number of nearest neighbours): 624 AICc value: 37987.84
Adaptive bandwidth (number of nearest neighbours): 393 AICc value: 37921.18
Adaptive bandwidth (number of nearest neighbours): 250 AICc value: 37838.8
Adaptive bandwidth (number of nearest neighbours): 162 AICc value: 37742.22
Adaptive bandwidth (number of nearest neighbours): 107 AICc value: 37626.83
Adaptive bandwidth (number of nearest neighbours): 73 AICc value: 37518.95
Adaptive bandwidth (number of nearest neighbours): 52 AICc value: 37432.07
Adaptive bandwidth (number of nearest neighbours): 39 AICc value: 37368.72
Adaptive bandwidth (number of nearest neighbours): 31 AICc value: 37341.04
Adaptive bandwidth (number of nearest neighbours): 26 AICc value: 37328.63
Adaptive bandwidth (number of nearest neighbours): 23 AICc value: 37317.39
Adaptive bandwidth (number of nearest neighbours): 21 AICc value: 37318.17
Adaptive bandwidth (number of nearest neighbours): 24 AICc value: 37320.45
Adaptive bandwidth (number of nearest neighbours): 22 AICc value: 37319.32
Adaptive bandwidth (number of nearest neighbours): 23 AICc value: 37317.39
- 建模分析
利用上述带宽,对模型进行求解,输出结果包含全局回归分析部分和地理加权回归结果部分。
#利用上述带宽求解模型
> gwr.res <- gwr.basic(PURCHASE~FLOORSZ+PROF+BATH2+BLDPWW1+TYPEDETCH+BLD60S+BLD70S,data = LNHP,
 1.                      bw=bw.gwr.1,kernel = "gaussian",adaptive = TRUE)
Warning messages:
1: In proj4string(data) : CRS object has comment, which is lost in output
2: In showSRID(uprojargs, format = "PROJ", multiline = "NO") :
  Discarded datum Unknown based on Airy 1830 ellipsoid in CRS definition
> gwr.res
   ***********************************************************************
 2.                       Package   GWmodel                             *
   ***********************************************************************
   Program starts at: 2020-08-12 11:26:25
   Call:
   gwr.basic(formula = PURCHASE ~ FLOORSZ + PROF + BATH2 + BLDPWW1 +
    TYPEDETCH + BLD60S + BLD70S, data = LNHP, bw = bw.gwr.1,
    kernel = "gaussian", adaptive = TRUE)

   Dependent (y) variable:  PURCHASE
   Independent variables:  FLOORSZ PROF BATH2 BLDPWW1 TYPEDETCH BLD60S BLD70S
   Number of data points: 1601
   ***********************************************************************
 3.                    Results of Global Regression                     *
   ***********************************************************************

   Call:
    lm(formula = formula, data = data)

   Residuals:
    Min      1Q  Median      3Q     Max
-130017  -21112    -838   17653  213018

   Coefficients:
                Estimate Std. Error t value Pr(>|t|)
   (Intercept) -72981.37    4280.18 -17.051  < 2e-16 ***
   FLOORSZ       1376.52      32.43  42.452  < 2e-16 ***
   PROF          2389.30      82.17  29.077  < 2e-16 ***
   BATH2        42336.48    4387.66   9.649  < 2e-16 ***
   BLDPWW1       7913.19    1950.47   4.057 5.21e-05 ***
   TYPEDETCH    28997.49    5582.12   5.195 2.31e-07 ***
   BLD60S      -18846.16    3685.56  -5.114 3.54e-07 ***
   BLD70S      -17967.23    3769.34  -4.767 2.04e-06 ***

   ---Significance stars
   Signif. codes:  0 '***' 0.001 '**' 0.01 '*' 0.05 '.' 0.1 ' ' 1
   Residual standard error: 35560 on 1593 degrees of freedom
   Multiple R-squared: 0.7271
   Adjusted R-squared: 0.7259
   F-statistic: 606.4 on 7 and 1593 DF,  p-value: < 2.2e-16
   ***Extra Diagnostic information
   Residual sum of squares: 2.01493e+12
   Sigma(hat): 35498.15
   AIC:  38107.55
   AICc:  38107.66
   ***********************************************************************
 4.          Results of Geographically Weighted Regression              *
   ***********************************************************************

   *********************Model calibration information*********************
   Kernel function: gaussian
   Adaptive bandwidth: 23 (number of nearest neighbours)
   Regression points: the same locations as observations are used.
   Distance metric: Euclidean distance metric is used.

   ****************Summary of GWR coefficient estimates:******************
                   Min.    1st Qu.     Median    3rd Qu.     Max.
   Intercept -173621.93  -63796.12  -42849.40  -20072.40  34434.0
   FLOORSZ       527.83    1123.90    1323.11    1545.73   2367.6
   PROF         -190.32    1239.95    1687.65    2069.46   3818.3
   BATH2      -51803.03    1603.15   18672.80   38155.37 121497.7
   BLDPWW1    -33885.39   -3409.93    4142.80   12008.60  67812.9
   TYPEDETCH  -82032.75   14591.91   34387.03   58899.84 218538.6
   BLD60S     -74331.88  -25835.12  -16850.74   -9014.28  56270.9
   BLD70S     -76086.00  -24942.11  -14159.41   -5921.48  37859.2
   ************************Diagnostic information*************************
   Number of data points: 1601
   Effective number of parameters (2trace(S) - trace(S'S)): 322.1961
   Effective degrees of freedom (n-2trace(S) + trace(S'S)): 1278.804
   AICc (GWR book, Fotheringham, et al. 2002, p. 61, eq 2.33): 37317.39
   AIC (GWR book, Fotheringham, et al. 2002,GWR p. 96, eq. 4.22): 36982.85
   Residual sum of squares: 866814912533
   R-square value:  0.8826025
   Adjusted R-square value:  0.8530009

   ***********************************************************************
   Program stops at: 2020-08-12 11:26:27
- 结果可视化
- 点数据可视化
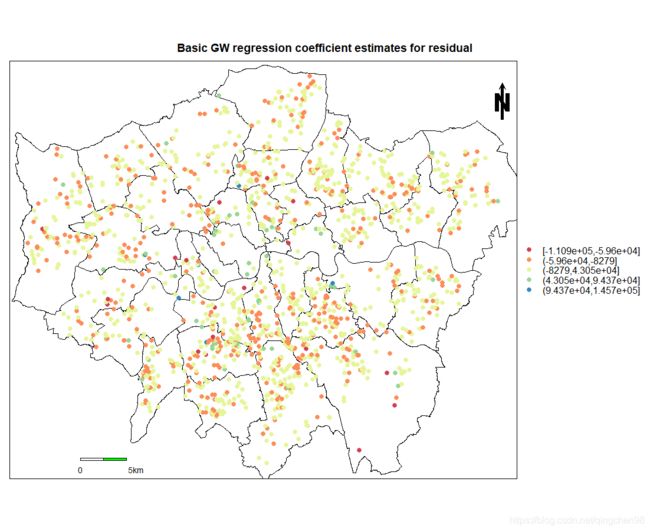
以下为点数据残差可视化代码与结果
#结果可视化
mypalette <- brewer.pal(6,"Spectral")
map.na <- list("SpatialPolygonsRescale",layout.north.arrow(),
               offset=c(556000,195000),scale=4000,col=1)
map.scale.1 <- list("SpatialPolygonsRescale",layout.scale.bar(),
                    offset=c(511000,158000),scale=5000,col=1,fill=c("transparent","green"))
map.scale.2 <- list("sp.text",c(511000,157000),"0",cex=0.9,col=1)
map.scale.3 <- list("sp.text",c(517000,157000),"5km",cex=0.9,col=1)
LN_bou <- list("sp.polygons",LN.bou)
map.layout <- list(LN_bou,map.na,map.scale.1,map.scale.2,map.scale.3)
spplot(gwr.res$SDF,"residual",key.space="right",col.regions=mypalette,
       at=c(-8,-6,-4,-2,0,2,4),main="Basic GW regression coefficient estimates for residual",
       sp.layout =map.layout)
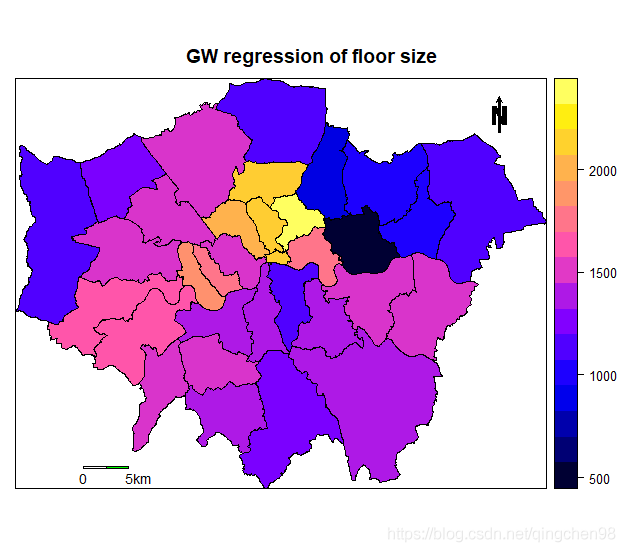
- 面数据可视化
将点数据统计到LondonBorough中的每个多边形中
#结果统计到区域中
require(rgeos)
dist = gDistance(LNHP,LN.bou,byid = TRUE)
nearest_dat = apply(dist, 1, which.min)
LN.bou$nn <- gwr.res$SDF$residual[nearest_dat]
spplot(LN.bou,"nn",sp.layout=map.layout,main="GW regression residuals")
LN.bou$floosz <- gwr.res$SDF$FLOORSZ[nearest_dat]
spplot(LN.bou,"floosz",sp.layout = map.layout,
       main="GW regression of floor size")


