Pyecharts 可视化
一、Pyecharts 认识
Pyecharts 是一个用于生成 Echarts 图表的类库
Echarts 是百度开源的一个数据可视化 JS 库,主要用于数据可视化,Pyecharts 是一 个用于生成 Echarts 图表的类库。实际上就是 Echarts 与 Python 的对接
使用 Pyecharts 可以生成独立的网页,也可以在 flask , Django 中集成使用
安装:pip install pyecharts==1.5
二、Pyecharts图表绘制准备
1、全局配置项
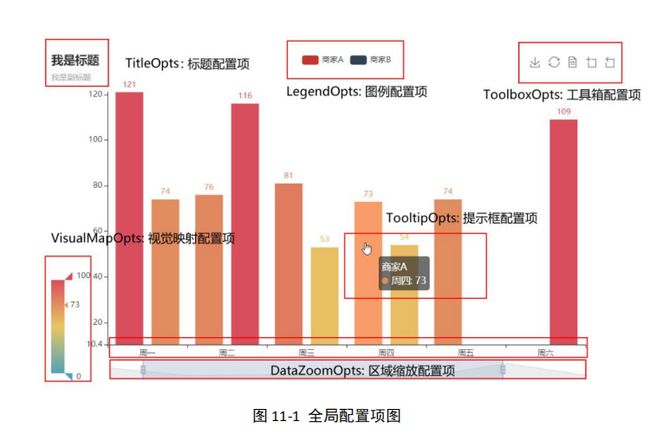
全局配置项可通过 set_global_options 方法设置
主要配置的内容为:
2、系列配置项
可以使用 set_series_options 方法设置
主要用来配置用来配置字体、颜色、线条灯具体的参数
3、注意:数据格式
Pyecharts 本质上在做的事情就是将 Echarts 的配置项由 Python dict 序列化为 JSON 格式,所以 Pyecharts 支持什么格式的数据类型取决于 JSON 支持什么数据类型
Pyecharts 是一个通用的第三方库,我们不可能关心开发者的所有使用场景,这个转换 需要我们引入 numpy/pandas 两个第三方库,而这两个库太重要了,所以我们将这个工作交 给了开发者
具体转换方式:
可以使用 Series.tolist()进行快速转换
4、更多配置
更多配置理解可参考:http://pyecharts.org/#/zh-cn/
颜色对照表课参考:http://www.fynas.com/system-drawing-color
三、柱状图
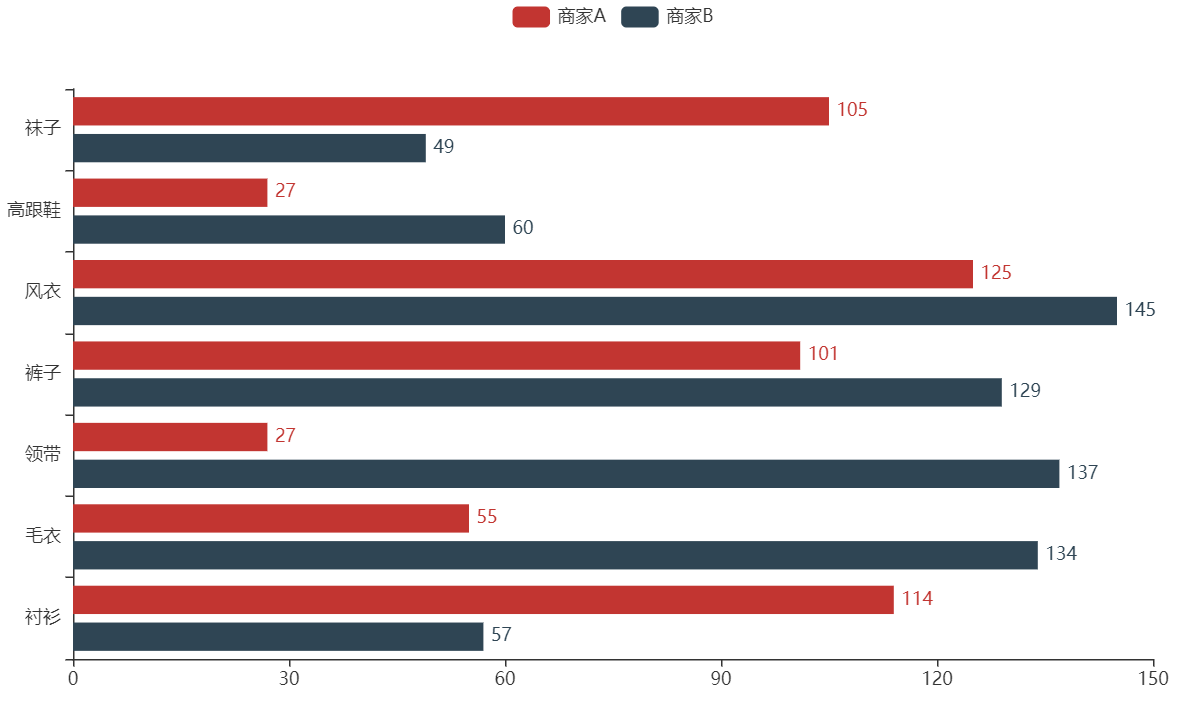
以绘制某商家 A、商家 B 的各类商品售卖数量为例,绘制柱状图
| 衬衫 | 毛衣 | 领带 | 裤子 | 风衣 | 高跟鞋 | 袜子 | |
|---|---|---|---|---|---|---|---|
| 商家 A | 114 | 55 | 27 | 101 | 125 | 27 | 105 |
| 商家 B | 57 | 134 | 137 | 129 | 145 | 60 | 49 |
代码实现:
from pyecharts import options as opts  # 配置模块
from pyecharts.charts import Bar

# 1、实例化bar对象
bar = Bar()

# 2、添加数据
# 横轴数据
bar.add_xaxis(
    xaxis_data=['衬衫', '毛衣', '领带', '裤子', '风衣', '高跟鞋', '袜子']
)

# 添加纵轴数据
bar.add_yaxis(
    series_name='商家A',  # 柱子名称
    yaxis_data=[114, 55, 27, 101, 125, 27, 105],  # 商家A的数据
)

# 添加纵轴数据
bar.add_yaxis(
    series_name='商家B',  # 柱子名称
    yaxis_data=[57, 134, 137, 129, 145, 60, 49],  # 商家A的数据
)

# 3、全局配置项
bar.set_global_opts(
    # 设置标题
    title_opts=opts.TitleOpts(
        title='Bar测试'
    )
)

# 4、系列配置项
bar.set_series_opts(
    # 设置标签
    label_opts=opts.LabelOpts(
        is_show=True,
        position='right', # 标签位置
    )
)

# 设置方向
bar.reversal_axis()

# 5、生成文件
bar.render('./柱状图.html')
四、饼图
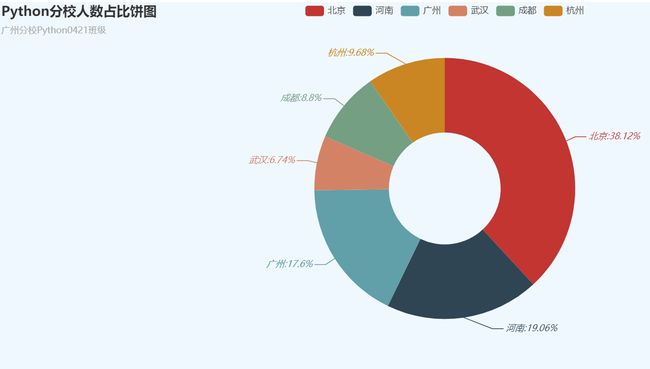
以各个地区分校的 Python 系统班人数统计数据为例,绘制饼图
各个地区分校人数统计表
| 地区分校 | Python系统班人数 |
|---|---|
| 北京 | 130 |
| 河南 | 65 |
| 广州 | 60 |
| 武汉 | 23 |
| 成都 | 30 |
| 杭州 | 33 |
代码实现:
# 导包
from pyecharts import options as opts
from pyecharts.charts import Pie
from pyecharts.globals import ThemeType  # 主题模块
import pandas as pd

# 1、实例化对象
pie = Pie(
    # 初始化配置
    init_opts=opts.InitOpts(
        width='1200px',  # 画布宽度
        height='500px',  # 画布高度
        # theme='white',  # 主题  ,设置方式
        theme=ThemeType.WHITE,  # 主题,设置方式
        page_title='Python分校人数占比饼图',
        # bg_color='#F0F8FF',  # 背景颜色
    )
)

# 加载分校数据
data = pd.read_excel('./Python地区分校人数.xlsx')
print('data:\n', data)
# for tmp in zip(data.loc[:,'分校'].tolist(),data.loc[:,'人数'].tolist()):
#     print(tmp)

data_pair = [(k, v) for k, v in zip(data.loc[:, '分校'].tolist(), data.loc[:, '人数'].tolist())]
print('data_pair:\n', data_pair)

# 2、添加数据
pie.add(
    series_name=data.loc[:, '分校'].tolist(),  # 图例名称
    data_pair=data_pair,  # 数据 ,格式为:[(k1,v1),(k2,v2),...],
    radius=['30%', '70%'],  # 半径,第一个为内径,第二个为外径,通常设置为百分数
    is_clockwise=True,  # 顺时针排布
)

# 3、设置全局配置项
pie.set_global_opts(
    # 设置标题
    title_opts=opts.TitleOpts(
        title='Python分校人数占比饼图',  # 标题名称
        subtitle='广州分校Python0421班级',  # 子标题
        pos_left='left',  # 位置
    ),
    # 设置图例
    legend_opts=opts.LegendOpts(
        is_show=True,  # 展示图例
        pos_left='center',  # 位置 --居中
    )
)

# 4、设置系列配置项
pie.set_series_opts(
    # 设置标签
    label_opts=opts.LabelOpts(
        is_show=True,  # 展示标签
        font_size=12,  # 字体大小
        font_style='italic',  # 字体风格,倾斜
        formatter='{b}:{d}%',  # 显示的样式 {a}系列名称 {b}数据项名称 {c}数值 {d}百分比
    )
)

# 5、生成文件
pie.render('./Python分校人数占比饼图.html')
五、折线图
新型冠状病毒肺炎(Corona Virus Disease 2019,COVID-19),简称“新冠肺炎”,是指 2019 新型冠状病毒感染导致的肺炎,2019 年 12 月以来,湖北省武汉市部分医院陆续发 现了多例有华南海鲜市场暴露史的不明原因肺炎病例,现已证实为2019 新型冠状病毒感染 引起的急性呼吸道传染病
为此,湖北政府、各省、乃至国家对于新冠状病毒的疫情的发展状况非常重视,对于患
病人员迅速采取隔离、治疗
此案例,借助国家发布数据(部分),对于疫情数据进行统计分析
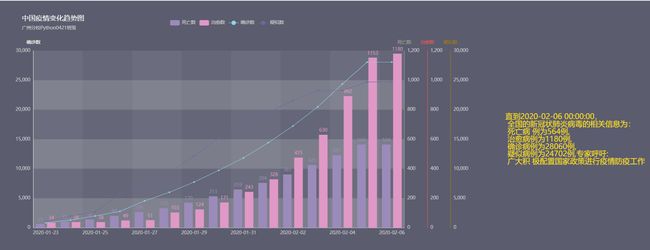
以截至2020年2月 6 日 10 时 49 分的全国疫情统计数据为例,绘制折线图、柱状图
中国疫情数据每日变化统计表
| 城市 | 时间 | 死亡数 | 治愈数 | 疑似数 | 省份 | 确诊数 |
|---|---|---|---|---|---|---|
| 全国 | 2020-02-06 | 564 | 1180 | 24702 | 全国 | 28060 |
| 全国 | 2020-02-05 | 564 | 1153 | 24702 | 全国 | 28060 |
| 全国 | 2020-02-04 | 491 | 892 | 23260 | 全国 | 24363 |
| 全国 | 2020-02-03 | 425 | 630 | 23214 | 全国 | 20471 |
| 全国 | 2020-02-02 | 361 | 475 | 21558 | 全国 | 17238 |
| 全国 | 2020-02-01 | 304 | 328 | 19544 | 全国 | 14411 |
| 全国 | 2020-01-31 | 259 | 243 | 17988 | 全国 | 11821 |
| 全国 | 2020-01-30 | 213 | 171 | 15238 | 全国 | 9720 |
| 全国 | 2020-01-29 | 170 | 124 | 12167 | 全国 | 7736 |
| 全国 | 2020-01-28 | 132 | 103 | 9239 | 全国 | 5997 |
| 全国 | 2020-01-27 | 106 | 51 | 6973 | 全国 | 4535 |
| 全国 | 2020-01-26 | 80 | 49 | 5794 | 全国 | 2761 |
| 全国 | 2020-01-25 | 56 | 38 | 2684 | 全国 | 1985 |
| 全国 | 2020-01-24 | 41 | 38 | 1965 | 全国 | 1297 |
| 全国 | 2020-01-23 | 25 | 34 | 1072 | 全国 | 830 |
代码实现:
# 绘图模块
from pyecharts.charts import *
# 配置模块
from pyecharts import options as opts
# 主题模块
from pyecharts.globals import ThemeType

import pandas as pd

# 1、实例化对象
bar = Bar(
    # init_opts=opts.InitOpts(
    #     width='2000px',
    #     # height='700px'
    # )
)

# 加载数据
history_data = pd.read_excel('./疫情历史数据.xls', index_col=0)
print('history_data:\n', history_data)

# 获取横轴数据
# (1)获取到时间数据,然后修改其类型为 str
x_data = history_data.loc[:, '时间'].astype('str')
# (2)反过来
x_data = x_data[::-1].tolist()

print('x_data:\n', x_data)

# 准备纵轴数据
# 死亡数据
death_data = history_data.loc[:, '死亡数'][::-1].tolist()
print('death_data:\n', death_data)
# 确诊数据
ensure_data = history_data.loc[:, '确诊数'][::-1].tolist()
print('ensure_data:\n', ensure_data)
# 疑似数据
suspected_data = history_data.loc[:, '疑似数'][::-1].tolist()
print('suspected_data:\n', suspected_data)
# 治愈数据
cure_data = history_data.loc[:, '治愈数'][::-1].tolist()
print('cure_data:\n', cure_data)

# 2、添加数据
# 横轴数据
bar.add_xaxis(
    xaxis_data=x_data,  # 横轴数据
)

# 纵轴数据
bar.add_yaxis(
    series_name='死亡数',  # 图例名称
    yaxis_data=death_data,  # 数据
    yaxis_index=1,  # 表示多个纵轴时,选择第1个纵轴作为死亡数的参考
)

bar.add_yaxis(
    series_name='治愈数',  # 图例名称
    yaxis_data=cure_data,  # 数据
    yaxis_index=2,  # 表示多个纵轴时,选择第2个纵轴作为 治愈数的参考
)

# 增加纵轴
bar.extend_axis(
    # 增加一个纵轴
    yaxis=opts.AxisOpts(
        type_='value',  # 坐标轴的类型
        name='死亡数',  # 坐标轴的名称
        min_=0,  # 最小值
        max_=1200,  # 最大值,
        position='right',  # 位置,右边
        offset=0,
        # 坐标线设置
        axisline_opts=opts.AxisLineOpts(
            is_show=True,  # 显示坐标线,
            # 坐标线的风格
            linestyle_opts=opts.LineStyleOpts(
                color='#a5a391',  # 线的颜色
            )
        ),
        # 坐标线上标签设置
        axislabel_opts=opts.LabelOpts(
            is_show=True,  # 展示轴线标签
            position='top',  # 标签位置
            formatter='{value}'  # 标签值
        )
    )
)
bar.extend_axis(
    # 增加一个纵轴
    yaxis=opts.AxisOpts(
        type_='value',  # 坐标轴的类型
        name='治愈数',  # 坐标轴的名称
        min_=0,  # 最小值
        max_=1200,  # 最大值,
        position='right',  # 位置,右边
        offset=60,
        # 坐标线设置
        axisline_opts=opts.AxisLineOpts(
            is_show=True,  # 显示坐标线,
            # 坐标线的风格
            linestyle_opts=opts.LineStyleOpts(
                color='#fd5956',  # 线的颜色
            )
        ),
        # 坐标线上标签设置
        axislabel_opts=opts.LabelOpts(
            is_show=True,  # 展示轴线标签
            position='top',  # 标签位置
            formatter='{value}'  # 标签值
        )
    )
)

bar.extend_axis(
    # 增加一个纵轴
    yaxis=opts.AxisOpts(
        type_='value',  # 坐标轴的类型
        name='疑似数',  # 坐标轴的名称
        min_=0,  # 最小值
        max_=30000,  # 最大值,
        position='right',  # 位置,右边
        offset=120,
        # 坐标线设置
        axisline_opts=opts.AxisLineOpts(
            is_show=True,  # 显示坐标线,
            # 坐标线的风格
            linestyle_opts=opts.LineStyleOpts(
                color='#ac7e04',  # 线的颜色
            )
        ),
        # 坐标线上标签设置
        axislabel_opts=opts.LabelOpts(
            is_show=True,  # 展示轴线标签
            position='top',  # 标签位置
            formatter='{value}'  # 标签值
        )
    )
)

# 绘制折线图
# 实例化对象
line = Line()
# 添加数据
# 添加横轴数据
line.add_xaxis(
    xaxis_data=x_data
)
# 添加纵轴数据
line.add_yaxis(
    series_name='确诊数',  # 图例名称
    y_axis=ensure_data,  # 确诊数据
    yaxis_index=0,  # 选择第0纵轴作为参考
    # 标签设置
    label_opts=opts.LabelOpts(
        is_show=False
    )
)
line.add_yaxis(
    series_name='疑似数',
    y_axis=suspected_data,  # 疑似数据
    yaxis_index=3,
    # 标签设置
    label_opts=opts.LabelOpts(
        is_show=False
    ),
)

# 3、全局配置
bar.set_global_opts(
    # 标题配置
    title_opts=opts.TitleOpts(
        title='中国疫情变化趋势图',  # 标题
        subtitle='广州分校Python0421班级',  # 子标题
        pos_left='3%',  # 标题的位置
        pos_top='5%',  # 标题的位置
        # 主标题 样式设置
        title_textstyle_opts=opts.TextStyleOpts(
            # color='#000000',  # 文字颜色
            font_style='normal',  # 字体风格
            # font_size=12,  # 字体大小
            font_weight='normal',  # 字体的粗细
        ),
        # 子标题 样式设置
        subtitle_textstyle_opts=opts.TextStyleOpts(
            # color='#000000',  # 文字颜色
            font_style='normal',  # 字体风格
            # font_size=7,  # 字体大小
            font_weight='normal',  # 字体的粗细
        )
    ),
    # 图例设置
    legend_opts=opts.LegendOpts(
        is_show=True,  # 显示图例
        pos_left='25%',  # 图例位置
        pos_top='7%',  # 图例位置
        # 图例样式 设置 --暂时不设置
        # textstyle_opts=opts.TextStyleOpts()
    ),
    # 纵轴设置
    yaxis_opts=opts.AxisOpts(
        type_='value',  # 坐标轴的类型
        name='确诊数',  # 坐标轴的名称
        min_=0,  # 最小值
        max_=30000,  # 最大值,
        position='left',  # 位置,左边
        # 坐标线设置
        axisline_opts=opts.AxisLineOpts(
            is_show=True,  # 显示坐标线,
            # 坐标线的风格
            linestyle_opts=opts.LineStyleOpts(
                color='#FFF5EE',  # 线的颜色
            )
        ),
        # 坐标线上标签设置
        axislabel_opts=opts.LabelOpts(
            is_show=True,  # 展示轴线标签
            position='top',
            formatter='{value}'
        )
    ),
    # 提示框设置
    tooltip_opts=opts.TooltipOpts(
        trigger='axis',  # 'axis': 坐标轴触发,主要在柱状图,折线图等会使用类目 轴的图表中使用
        axis_pointer_type='cross',  # 'cross':十字准星指示器。其实是种简写,表示启用两个正交的轴的 axisPointer。
    ),
    # 文本框设置
    graphic_opts=opts.GraphicGroup(
        # 图形的配置项
        # 文本相对于图的位置
        graphic_item=opts.GraphicItem(
            # 控制整体的位置
            left="75%",
            top="45%",
        ),
        children=[
            # # opts.GraphicRect 控制方框的显示
            # # 如果不需要方框,去掉该段即可
            # opts.GraphicRect(
            #     # 文本框位置
            #     graphic_item=opts.GraphicItem(
            #         z=100,  # z 轴方向的显示位置
            #         left="center",  # 左右位置
            #         top="middle",  # 上下位置
            #     ),
            #     # 文本框形状
            #     graphic_shape_opts=opts.GraphicShapeOpts(
            #         width=420,  # 宽度
            #         height=180,  # 高度
            #     ),
            #     # 文本框的样式
            #     graphic_basicstyle_opts=opts.GraphicBasicStyleOpts(
            #         fill="#fff",  # 文本框填充颜色
            #         stroke="#00008B",  # 边框颜色
            #         line_width=10,  # 边框宽度
            #         shadow_blur=8,  # 阴影相关
            #         shadow_offset_x=3,  # 阴影相关
            #         shadow_offset_y=3,  # 阴影相关
            #         shadow_color="rgba(0,0,0,0.3)",  # 阴影颜色
            #     ),
            # ),
            # 配置文本
            opts.GraphicText(
                # 配置文本的位置  --->文本相对于文本框的位置
                graphic_item=opts.GraphicItem(
                    left="center",
                    top='middle',
                    z=100,  # 显示位置
                    scale=[1.5, 1.5],  # 表示缩放
                ),
                graphic_textstyle_opts=opts.GraphicTextStyleOpts(
                    # 文本信息
                    text="直到{},\n 全国的新冠状肺炎病毒的相关信息为:\n 死亡病 例为{}例,\n 治愈病例为{}例,\n 确诊病例为{}例,\n 疑似病例为{}例,专家呼吁:\n 广大积 极配置国家政策进行疫情防疫工作".format(
                        history_data.loc[0, '时间'], history_data.loc[0, '死亡数'], history_data.loc[0, '治愈数'],
                        history_data.loc[0, '确诊数'], history_data.loc[0, '疑似数']
                    ),

                    font="13px Microsoft YaHei",  # 字体以及字体大小
                    text_align='left',  # 水平方向左对齐
                    text_vertical_align='middle',  # 垂直对齐方式 :默认 None,
                    # 字体的颜色和宽度
                    graphic_basicstyle_opts=opts.GraphicBasicStyleOpts(
                        fill='#ffdf22',  # 颜色
                        line_width=1.2,  # 宽度
                    )
                )
            )
        ]
    )
)

# 4、增加系列配置项
bar.set_series_opts(
    # 标签设置
    label_opts=opts.LabelOpts(
        is_show=True,  # 展示标签
        position='top',  # 标签位置
    ),
)
# 层叠多个图形
all_chart = bar.overlap(line)

# 组合
grid = Grid(
    # 初始化配置
    init_opts=opts.InitOpts(
        width="1750px",  # 宽度
        height='650px',  # 高度
        theme=ThemeType.PURPLE_PASSION,  # 主题
    )
)

# 添加图表
grid.add(
    # 添加图表
    chart=all_chart,
    # 设置组合配置
    grid_opts=opts.GridOpts(pos_top="20%",  # 位置
                            pos_left="5%",  # 位置
                            pos_right="40%"  # 位置
                            ),
    is_control_axis_index=True,  # 控制索引
)

# 5、生成文件
grid.render('./柱状图、折线图组合绘制.html')
六、地图绘制
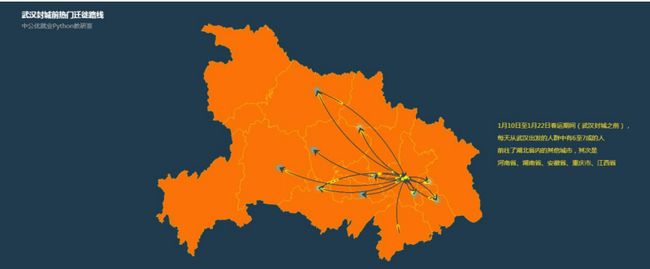
(1)以武汉封城前(0120、0121、0122)的热门迁徙路线地图为例,绘制省地图
武汉封城前的人流迁徙城市
| 时间 | 城市 |
|---|---|
| 2020-01-20 | 入武汉 孝感、黄冈、鄂州、荆州、黄石、襄阳 |
| 2020-01-20 | 出武汉 孝感、黄冈、荆州、襄阳、黄石、荆门、鄂州、随 州、仙桃 |
| 2020-01-21 | 入武汉 孝感、黄冈、荆州、鄂州、黄石 |
| 2020-01-22 | 入武汉 孝感、黄冈、鄂州、荆州、咸宁、黄石 |
| 2020-01-22 | 出武汉 孝感、黄冈、荆州、襄阳、荆州、随州、宜昌、黄 石、鄂州 |
代码实现:
# 导入流向地图
from pyecharts.charts import Geo
# 主题模块
from pyecharts.globals import ThemeType
# 配置模块
from pyecharts import options as opts
#
from pyecharts.globals import GeoType

# 1、实例化对象
geo = Geo(
    # 初始化配置
    init_opts=opts.InitOpts(
        width='900px',
        height='500px',
        theme=ThemeType.CHALK,  # 主题
        page_title='流向地图',  # 网页名称
    )
)

# 2、添加地图类型
geo.add_schema(
    maptype='湖北',  # 地图类型,中国地图为china,广东地图为广东,世界地图为world
    # 修改地图样式
    itemstyle_opts=opts.ItemStyleOpts(
        # 地图颜色
        color='#FF8C00',
        # 地图边缘颜色
        border_color='#ffdf22',
        area_color='#FF8C00'
    )
)
# 构建武汉封城前的出入数据 (湖北省内数据)
# 出--代表从武汉--->该城市
# 入--代表从该城市--->武汉
data_0120_ru = '孝感、黄冈、鄂州、荆州、黄石、襄阳'
data_0120_chu = '孝感、黄冈、荆州、襄阳、黄石、荆门、鄂州、随州、仙桃'
data_0121_ru = '孝感、黄冈、荆州、鄂州、黄石'
data_0121_chu = '孝感、黄冈、荆州、襄阳、荆门、黄石、随州、鄂州、仙桃'
data_0122_ru = '孝感、黄冈、鄂州、荆州、咸宁、黄石'
data_0122_chu = '孝感、黄冈、荆州、襄阳、荆州、随州、宜昌、黄石、鄂州'

# data_pair 可以准确为 [(出,入),(出,入),...]
# [(孝感,武汉),(黄冈,武汉),(武汉,黄石),...]
# 构建一个List来存储入武汉的数据
data_ru = []
# 构建 data_pair
for city_str in [data_0120_ru, data_0121_ru, data_0122_ru]:
    # city_str : 入武汉的城市字符串
    # 拆分
    city_list = city_str.split('、')

    # print('city_list:\n', city_list)

    # 将 city_list 加入到 data_ru
    data_ru.extend(city_list)

    # 对 data_ru 去重
    data_ru = list(set(data_ru))

    # 构建 data_pair_ru
    data_pair_ru = [(city, '武汉') for city in data_ru]

# 构建一个List来存储出武汉的数据
data_chu = []

# 构建出武汉的数据
for city_str in [data_0120_chu, data_0121_chu, data_0122_chu]:
    # city_str : 出武汉的城市的字符串
    # 拆分
    city_list = city_str.split("、")
    # city_list 加入到 data_chu
    data_chu.extend(city_list)
    # 对 data_chu 去重
    data_chu = list(set(data_chu))
    # 构建 data_pair_chu
    data_pair_chu = [('武汉', city) for city in data_chu]

# print('data_pair_ru:\n', data_pair_ru)
# print('data_pair_chu:\n', data_pair_chu)

# 组合出武汉的数据及入武汉的数据
data_pair = data_pair_ru + data_pair_chu
print('data_pair:\n', data_pair)

# 3、添加数据
geo.add(
    series_name='',  # 设置为空
    data_pair=data_pair,  # 数据
    type_=GeoType.LINES,  # 线状
    # 涟漪特效设置
    effect_opts=opts.EffectOpts(
        # 波纹绘制样式
        brush_type='stroke',
        # 特效点的类型
        symbol='arrow',
        symbol_size=5,
        color='yellow'
    ),
    # 线的样式
    linestyle_opts=opts.LineStyleOpts(
        # 弯曲程度
        curve=0.2,
        # 线的样式
        type_='solid',
        color='#7FFF00'
    )
)
# 4、全局配置项
geo.set_global_opts(
    # 标题配置
    title_opts=opts.TitleOpts(
        title='武汉封城前流向地图',
        pos_left='center'
    ),
    legend_opts=opts.LegendOpts(
        is_show=False
    ),
    # 文本框设置
    graphic_opts=opts.GraphicGroup(
        # 图形的配置项
        # 文本相对于图的位置
        graphic_item=opts.GraphicItem(
            # 控制整体的位置
            left="85%",
            top="45%",
        ),
        children=[
            # # opts.GraphicRect 控制方框的显示
            # # 如果不需要方框,去掉该段即可
            # opts.GraphicRect(
            #     # 文本框位置
            #     graphic_item=opts.GraphicItem(
            #         z=100,  # z 轴方向的显示位置
            #         left="center",  # 左右位置
            #         top="middle",  # 上下位置
            #     ),
            #     # 文本框形状
            #     graphic_shape_opts=opts.GraphicShapeOpts(
            #         width=420,  # 宽度
            #         height=180,  # 高度
            #     ),
            #     # 文本框的样式
            #     graphic_basicstyle_opts=opts.GraphicBasicStyleOpts(
            #         fill="#fff",  # 文本框填充颜色
            #         stroke="#00008B",  # 边框颜色
            #         line_width=10,  # 边框宽度
            #         shadow_blur=8,  # 阴影相关
            #         shadow_offset_x=3,  # 阴影相关
            #         shadow_offset_y=3,  # 阴影相关
            #         shadow_color="rgba(0,0,0,0.3)",  # 阴影颜色
            #     ),
            # ),
            # 配置文本
            opts.GraphicText(
                # 配置文本的位置  --->文本相对于文本框的位置
                graphic_item=opts.GraphicItem(
                    left="center",
                    top='middle',
                    z=100,  # 显示位置
                    scale=[1, 1],  # 表示缩放
                ),
                graphic_textstyle_opts=opts.GraphicTextStyleOpts(
                    # 文本信息
                    text='我爱北京天安门',

                    font="13px Microsoft YaHei",  # 字体以及字体大小
                    text_align='left',  # 水平方向左对齐
                    text_vertical_align='middle',  # 垂直对齐方式 :默认 None,
                    # 字体的颜色和宽度
                    graphic_basicstyle_opts=opts.GraphicBasicStyleOpts(
                        fill='#ffdf22',  # 颜色
                        line_width=1.2,  # 宽度
                    )
                )
            )
        ]
    )
)

# 5、系列配置项
geo.set_series_opts(
    # 标签配置
    label_opts=opts.LabelOpts(
        is_show=False
    )
)

# 6、生成文件
geo.render('./流向地图.html')
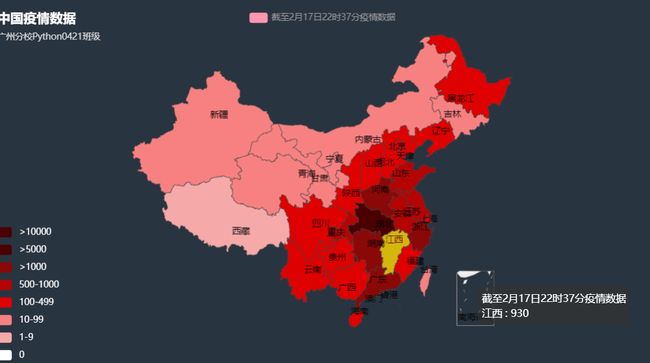
(2)以截至 2020 年 2 月 17 日 22 时 37 分为止的全国疫情数据为例,绘制全国地图
截至 2020 年 2 月 17 日 22 时 37 分为止的全国疫情数据表(部分)
| 城市 | 时间 | 死亡数 | 治愈数 | 疑似数 | 省份 | 确诊数 |
|---|---|---|---|---|---|---|
| China | 截至 2 月 17 日 22 时 37 分 | 1772 | 1127 | 9 7264 | 亚洲 | 70642 |
| China | 截至 2 月 17 日 22 时 37 分 | 105 | 1425 | 1563 | 日增加值 | 2048 |
| 湖北 | 截至 2 月 17 日 22 时 37 分 | 1696 | 6693 | 0 | 湖北 | 58182 |
| 武汉 | 截至 2 月 17 日 22 时 37 分 | 1309 | 3507 | 0 | 湖北 | 41152 |
| 孝感 | 截至2 月 17 日 22 时 37 分 | 70 | 449 | 0 | 湖北 | 3279 |
| 黄冈 | 截至2 月 17 日 22 时 37 分 | 78 | 839 | 0 | 湖北 | 2831 |
| 荆州 | 截至2 月 17 日 22 时 37 分 | 37 | 305 | 0 | 湖北 | 1501 |
| 鄂州 | 截至2 月 17 日 22 时 37 分 | 35 | 244 | 0 | 湖北 | 1274 |
| 随州 | 截至2 月 17 日 22 时 37 分 | 24 | 140 | 0 | 湖北 | 1267 |
| 襄阳 | 截至2 月 17 日 22 时 37 分 | 20 | 151 | 0 | 湖北 | 1155 |
| 黄石 | 截至2 月 17 日 22 时 37 分 | 15 | 207 | 0 | 湖北 | 983 |
| 荆门 | 截至2 月 17 日 22 时 37 分 | 33 | 132 | 0 | 湖北 | 915 |
| 宜昌 | 截至2 月 17 日 22 时 37 分 | 24 | 156 | 0 | 湖北 | 895 |
| 咸宁 | 截至2 月 17 日 22 时 37 分 | 10 | 181 | 0 | 湖北 | 861 |
| 十堰 | 截至2 月 17 日 22 时 37 分 | 2 | 126 | 0 | 湖北 | 612 |
| 仙桃 | 截至2 月 17 日 22 时 37 分 | 19 | 107 | 0 | 湖北 | 531 |
| 天门 | 截至2 月 17 日 22 时 37 分 | 10 | 39 | 0 | 湖北 | 485 |
| 恩施州 | 截至2 月 17 日 22 时 37 分 | 4 | 82 | 0 | 湖北 | 249 |
| 潜江 | 截至2 月 17 日 22 时 37 分 | 6 | 18 | 0 | 湖北 | 182 |
| 神农架林区 | 截至2 月 17 日 22 时 37 分 | 0 | 10 | 0 | 湖北 | 10 |
| 广东 | 截至 2 月 17 日 22 时 37 分 | 4 | 524 | 1 | 广东 | 1322 |
| 深圳 | 截至 2 月 17 日 22 时 37 分 | 2 | 152 | 0 | 广东 | 415 |
| 广州 | 截至 2 月 17 日 22 时 37 分 | 0 | 131 | 0 | 广东 | 339 |
代码实现:
# 导入绘制模块
from pyecharts.charts import Map
# 导入配置模块
from pyecharts import options as opts
# 导入主题模块
from pyecharts.globals import ThemeType

import pandas as pd

# 1、实例化对象
map = Map(
    # 初始化配置
    init_opts=opts.InitOpts(
        width='900px',
        height='500px',
        theme=ThemeType.CHALK,  # 主题
        page_title='中国地图',  # 网页名称
    )
)
# 准备数据 ---各个省份的确诊人数
data = pd.read_excel('./截至2月17日22时37分疫情数据.xlsx')
print('data:\n', data)
# 先拿到中国各个省份的 数据
# 确定bool数组 ---省份的数据在  省份=城市 的行
mask = data.loc[:, '省份'] == data.loc[:, '城市']
# 筛选数据
data = data.loc[mask, ['省份', '确诊数']]
print('data:\n', data)
# 准备data_pair
data_pair = [(k, v) for k, v in zip(data.loc[:, '省份'].tolist(), data.loc[:, '确诊数'].tolist())]

print('data_pair:\n', data_pair)
# 2、添加数据
map.add(
    series_name='截至2月17日22时37分疫情数据',  # 图例名称
    data_pair=data_pair,  # 数据,格式为 [(k1,v1),(k2,v2),...]
    maptype='china',  # 地图类型
    is_map_symbol_show=False,  # 标记点取消
)

# 3 全局配置
map.set_global_opts(
    # 标题设置
    title_opts=opts.TitleOpts(
        title='中国疫情数据',
        subtitle='广州分校Python0421班级',
        pos_top='3%'
    ),
    # 图例
    legend_opts=opts.LegendOpts(
        is_show=True,
        pos_top='3%'
    ),
    # 设置 VisualMap
    visualmap_opts=opts.VisualMapOpts(
        is_show=True,  # 展示
        type_='color',  # 用颜色来区分不同的值,
        min_=0,  # 最小值
        max_=60000,  # 最大值,
        is_piecewise=True,  # 开启分段显示
        pieces=[
            {
     "min": 10001, "label": ">10000", "color": "#4b0101"},
            {
     "max": 10000, "min": 5001, "label": ">5000", "color": "#4a0100"},
            {
     "max": 5000, "min": 1001, "label": ">1000", "color": "#8A0808"},
            {
     "max": 1000, "min": 500, "label": "500-1000", "color": "#B40404"},
            {
     "max": 499, "min": 108, "label": "100-499", "color": "#DF0101"},
            {
     "max": 99, "min": 10, "label": '10-99', "color": "#F78181"},
            {
     "max": 9, "min": 1, "label": "1-9", "color": "#F5A9A9"},
            {
     "max": 0, "min": 0, "label": "0", "color": "#FFFFFF"},
        ],
        textstyle_opts=opts.TextStyleOpts(
            color='white'
        )
    )
)

# 4、系列配置
map.set_series_opts(
    label_opts=opts.LabelOpts(
        is_show=True,
    )
)

# 5、生成文件
map.render('./截至2月17日22时37分疫情数据.html')
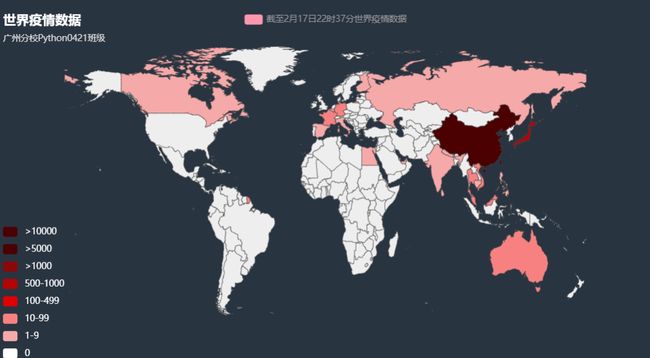
(3)以截至 2020 年 2 月 17 日 22 时 37 分为止的全球疫情数据为例,绘制世界地图
表 11-15 截至 2020 年 2 月 17 日 22 时 37 分为止的全球疫情数据表(部分)
| 城市 | 时间 | 死亡数 | 治愈数 | 疑似数 | 省份 | 确诊数 |
|---|---|---|---|---|---|---|
| 新加坡 | 截至 2 月 17 日 22 时 37 分 | 0 | 1 | 0 | 亚洲 | 77 |
| 日本 | 截至 2 月 17 日 22 时 37 分 | 1 | 1 | 0 | 亚洲 | 519 |
| 韩国 | 截至 2 月 17 日 22 时 37 分 | 0 | 1 | 0 | 亚洲 | 30 |
| 泰国 | 截至 2 月 17 日 22 时 37 分 | 0 | 1 | 0 | 亚洲 | 35 |
| 马来西亚 | 截至 2 月 17 日 22 时 37 分 | 0 | 1 | 4 | 亚洲 | 22 |
| 德国 | 截至 2 月 17 日 22 时 37 分 | 0 | 1 | 3 | 欧洲 | 16 |
| 美国 | 截至 2 月 17 日 22 时 37 分 | 0 | 1 | 0 | 北美洲 | 15 |
| 越南 | 截至 2 月 17 日 22 时 37 分 | 0 | 1 | 0 | 亚洲 | 16 |
| 法国 | 截至 2 月 17 日 22 时 37 分 | 1 | 1 | 0 | 欧洲 | 12 |
| 加拿大 | 截至 2 月 17 日 22 时 37 分 | 0 | 1 | 9 | 北美洲 | 8 |
| 澳大利亚 | 截至 2 月 17 日 22 时 37 分 | 0 | 1 | 0 | 大洋洲 | 15 |
| 阿联酋 | 截至 2 月 17 日 22 时 37 分 | 0 | 1 | 0 | 亚洲 | 9 |
| 意大利 | 截至 2 月 17 日 22 时 37 分 | 0 | 1 | 2 | 欧洲 | 3 |
| 西班牙 | 截至 2 月 17 日 22 时 37 分 | 0 | 1 | 0 | 欧洲 | 2 |
| 尼泊尔 | 截至 2 月 17 日 22 时 37 分 | 0 | 1 | 2 | 亚洲 | 1 |
| 斯里兰卡 | 截至 2 月 17 日 22 时 37 分 | 0 | 1 | 0 | 亚洲 | 1 |
| 英国 | 截至 2 月 17 日 22 时 37 分 | 0 | 1 | 5 | 欧洲 | 9 |
| 瑞典 | 截至 2 月 17 日 22 时 37 分 | 0 | 1 | 0 | 欧洲 | 1 |
| 菲律宾 | 截至 2 月 17 日 22 时 37 分 | 1 | 1 | 3 | 1 亚洲 | 3 |
| 埃及 | 截至 2 月 17 日 22 时 37 分 | 0 | 1 | 0 | 非洲 | 1 |
| 柬埔寨 | 截至 2 月 17 日 22 时 37 分 | 0 | 1 | 0 | 亚洲 | 1 |
| 芬兰 | 截至 2 月 17 日 22 时 37 分 | 0 | 1 | 0 | 欧洲 | 1 |
| 印度 | 截至 2 月 17 日 22 时 37 分 | 0 | 1 | 0 | 亚洲 | 3 |
| 俄罗斯 | 截至 2 月 17 日 22 时 37 分 | 0 | 1 | 0 | 欧洲 | 2 |
| 比利时 | 截至 2 月 17 日 22 时 37 分 | 0 | 1 | 0 | 欧洲 | 1 |
代码实现:
# 导包
from pyecharts import options as opts
from pyecharts.globals import ThemeType
from pyecharts.charts import Map
import pandas as pd
from translate import Translator

# 1、实例化对象
map = Map(
    # 初始化配置
    init_opts=opts.InitOpts(
        width='900px',
        height='500px',
        theme=ThemeType.CHALK,  # 主题
        page_title='世界地图',  # 网页名称
    )
)

# # 准备数据
data = pd.read_excel('./截至2月17日22时37分疫情数据.xlsx')
# print('data:\n', data)

# 获取世界各国的数据
# 确定bool数组
mask = data.loc[:, '省份'].str.contains('洲')
# 筛选数据
data = data.loc[mask, ['城市', '确诊数']]
print('data:\n', data)


# 如果绘制世界地图,默认不支持中文的
# 需要将中文翻译成英文 --->translate
# 安装:pip install translate

def translate_country_name(country_name):
    """
    将中文的国家名称翻译为英文
    :param country_name: 中文的国家名称
    :return: 英文的国家名称
    """
    # 1、实例化对象
    translator = Translator(from_lang='chinese', to_lang='english')
    # 2、进行翻译
    english_country_nam = translator.translate(country_name)
    # 3、返回
    return english_country_nam


# transform调用自定义函数
data.loc[:, '国家名称_english'] = data.loc[:, '城市'].transform(translate_country_name)

print('data:\n',data)

# 构建data_pair数据
data_pair = [(k, v) for k, v in zip(data.loc[:, '国家名称_english'].tolist(), data.loc[:, '确诊数'].tolist())]
#
print('data_pair:\n', data_pair)

data_pair = [('China', 70642), ('Singapore', 77), ('Japan', 519), ('South Korea', 30), ('Thailand', 35),
             ('Malaysia', 22), ('Germany', 16), ('US', 15), ('Vietnam', 16), ('France', 12), ('Canada', 8),
             ('Australia', 15), ('United Arab Emirates', 9), ('Italy', 3), ('Spain', 2), ('Nepal', 1), ('Sri Lanka', 1),
             ('UK', 9), ('Swedish', 1), ('Philippines', 3), ('Egypt', 1), ('Cambodia', 1), ('Finland', 1), ('India', 3),
             ('Russia', 2), ('Belgium', 1)]
#
# 2、添加数据
map.add(
    series_name='截至2月17日22时37分世界疫情数据',
    data_pair=data_pair,
    maptype='world',
    is_map_symbol_show=False
)

# 3、设置全局配置
map.set_global_opts(
    # 标题设置
    title_opts=opts.TitleOpts(
        title='世界疫情数据',
        subtitle='广州分校Python0421班级',
        pos_top='3%'
    ),
    # 图例
    legend_opts=opts.LegendOpts(
        is_show=True,
        pos_top='3%'
    ),
    # 设置 VisualMap
    visualmap_opts=opts.VisualMapOpts(
        is_show=True,  # 展示
        type_='color',  # 用颜色来区分不同的值,
        min_=0,  # 最小值
        max_=80000,  # 最大值,
        is_piecewise=True,  # 开启分段显示
        pieces=[
            {
     "min": 10001, "label": ">10000", "color": "#4b0101"},
            {
     "max": 10000, "min": 5001, "label": ">5000", "color": "#4a0100"},
            {
     "max": 5000, "min": 1001, "label": ">1000", "color": "#8A0808"},
            {
     "max": 1000, "min": 500, "label": "500-1000", "color": "#B40404"},
            {
     "max": 499, "min": 108, "label": "100-499", "color": "#DF0101"},
            {
     "max": 99, "min": 10, "label": '10-99', "color": "#F78181"},
            {
     "max": 9, "min": 1, "label": "1-9", "color": "#F5A9A9"},
            {
     "max": 0, "min": 0, "label": "0", "color": "#FFFFFF"},
        ],
        textstyle_opts=opts.TextStyleOpts(
            color='white'
        )
    )
)

# 4、设置系列配置
map.set_series_opts(
    label_opts=opts.LabelOpts(
        is_show=False,
    )
)

# 5、生成文件
map.render('./疫情数数据世界地图.html')
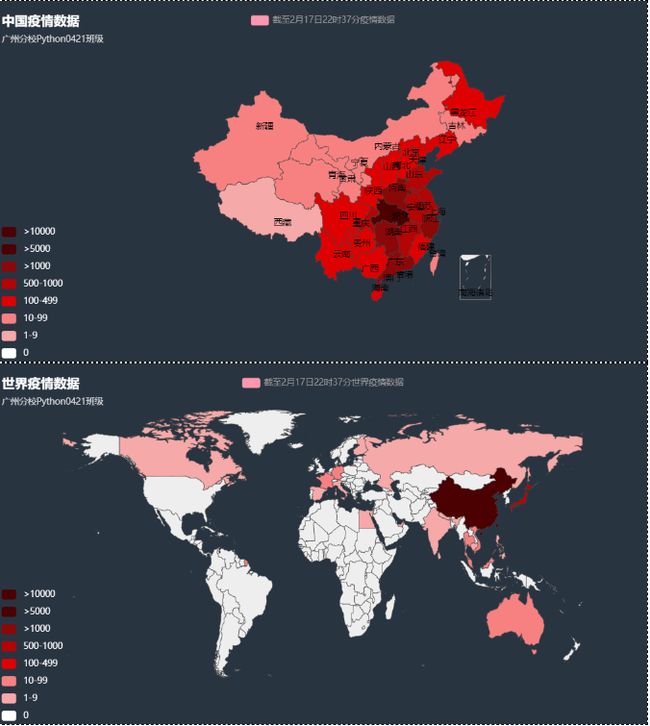
七、组合中国地图和世界地图
代码实现:
# 导入绘制模块
from pyecharts.charts import Map
# 导入配置模块
from pyecharts import options as opts
# 导入主题模块
from pyecharts.globals import ThemeType

import pandas as pd

from pyecharts.charts import Grid, Page

# ================================================中国地图 =================================================

# 1、实例化对象
map_china = Map(
    # 初始化配置
    init_opts=opts.InitOpts(
        width='900px',
        height='500px',
        theme=ThemeType.CHALK,  # 主题
        page_title='中国地图',  # 网页名称
    )
)
# 准备数据 ---各个省份的确诊人数
data = pd.read_excel('./截至2月17日22时37分疫情数据.xlsx')
print('data:\n', data)
# 先拿到中国各个省份的 数据
# 确定bool数组 ---省份的数据在  省份=城市 的行
mask = data.loc[:, '省份'] == data.loc[:, '城市']
# 筛选数据
data_china = data.loc[mask, ['省份', '确诊数']]
print('data_china:\n', data_china)
# 准备data_pair
data_pair_china = [(k, v) for k, v in zip(data_china.loc[:, '省份'].tolist(), data_china.loc[:, '确诊数'].tolist())]

print('data_pair_china:\n', data_pair_china)
# 2、添加数据
map_china.add(
    series_name='截至2月17日22时37分疫情数据',  # 图例名称
    data_pair=data_pair_china,  # 数据,格式为 [(k1,v1),(k2,v2),...]
    maptype='china',  # 地图类型
    is_map_symbol_show=False,  # 标记点取消
)

# 3 全局配置
map_china.set_global_opts(
    # 标题设置
    title_opts=opts.TitleOpts(
        title='中国疫情数据',
        subtitle='广州分校Python0421班级',
        pos_top='3%'
    ),
    # 图例
    legend_opts=opts.LegendOpts(
        is_show=True,
        pos_top='3%'
    ),
    # 设置 VisualMap
    visualmap_opts=opts.VisualMapOpts(
        is_show=True,  # 展示
        type_='color',  # 用颜色来区分不同的值,
        min_=0,  # 最小值
        max_=60000,  # 最大值,
        is_piecewise=True,  # 开启分段显示
        pieces=[
            {
     "min": 10001, "label": ">10000", "color": "#4b0101"},
            {
     "max": 10000, "min": 5001, "label": ">5000", "color": "#4a0100"},
            {
     "max": 5000, "min": 1001, "label": ">1000", "color": "#8A0808"},
            {
     "max": 1000, "min": 500, "label": "500-1000", "color": "#B40404"},
            {
     "max": 499, "min": 108, "label": "100-499", "color": "#DF0101"},
            {
     "max": 99, "min": 10, "label": '10-99', "color": "#F78181"},
            {
     "max": 9, "min": 1, "label": "1-9", "color": "#F5A9A9"},
            {
     "max": 0, "min": 0, "label": "0", "color": "#FFFFFF"},
        ],
        textstyle_opts=opts.TextStyleOpts(
            color='white'
        )
    )
)

# 4、系列配置
map_china.set_series_opts(
    label_opts=opts.LabelOpts(
        is_show=True,
    )
)

# ===================================================世界地图 ============================================

from translate import Translator

# 1、实例化对象
map_world = Map(
    # 初始化配置
    init_opts=opts.InitOpts(
        width='900px',
        height='500px',
        theme=ThemeType.CHALK,  # 主题
        page_title='世界地图',  # 网页名称
    )
)

# 获取世界各国的数据
# 确定bool数组
mask = data.loc[:, '省份'].str.contains('洲')
# 筛选数据
data_world = data.loc[mask, ['城市', '确诊数']]
print('data_world:\n', data_world)


# 如果绘制世界地图,默认不支持中文的
# 需要将中文翻译成英文 --->translate
# 安装:pip install translate

def translate_country_name(country_name):
    """
    将中文的国家名称翻译为英文
    :param country_name: 中文的国家名称
    :return: 英文的国家名称
    """
    # 1、实例化对象
    translator = Translator(from_lang='chinese', to_lang='english')
    # 2、进行翻译
    english_country_nam = translator.translate(country_name)
    # 3、返回
    return english_country_nam


# transform调用自定义函数
data_world.loc[:, '国家名称_english'] = data_world.loc[:, '城市'].transform(translate_country_name)

print('data_world:\n', data_world)

# 构建data_pair数据
data_pair_world = [(k, v) for k, v in
                   zip(data_world.loc[:, '国家名称_english'].tolist(), data_world.loc[:, '确诊数'].tolist())]
#
print('data_pair_world:\n', data_pair_world)

data_pair_world = [('China', 70642), ('Singapore', 77), ('Japan', 519), ('South Korea', 30), ('Thailand', 35),
                   ('Malaysia', 22), ('Germany', 16), ('US', 15), ('Vietnam', 16), ('France', 12), ('Canada', 8),
                   ('Australia', 15), ('United Arab Emirates', 9), ('Italy', 3), ('Spain', 2), ('Nepal', 1),
                   ('Sri Lanka', 1),
                   ('UK', 9), ('Swedish', 1), ('Philippines', 3), ('Egypt', 1), ('Cambodia', 1), ('Finland', 1),
                   ('India', 3),
                   ('Russia', 2), ('Belgium', 1)]
#
# 2、添加数据
map_world.add(
    series_name='截至2月17日22时37分世界疫情数据',
    data_pair=data_pair_world,
    maptype='world',
    is_map_symbol_show=False
)

# 3、设置全局配置
map_world.set_global_opts(
    # 标题设置
    title_opts=opts.TitleOpts(
        title='世界疫情数据',
        subtitle='广州分校Python0421班级',
        pos_top='3%'
    ),
    # 图例
    legend_opts=opts.LegendOpts(
        is_show=True,
        pos_top='3%'
    ),
    # 设置 VisualMap
    visualmap_opts=opts.VisualMapOpts(
        is_show=True,  # 展示
        type_='color',  # 用颜色来区分不同的值,
        min_=0,  # 最小值
        max_=80000,  # 最大值,
        is_piecewise=True,  # 开启分段显示
        pieces=[
            {
     "min": 10001, "label": ">10000", "color": "#4b0101"},
            {
     "max": 10000, "min": 5001, "label": ">5000", "color": "#4a0100"},
            {
     "max": 5000, "min": 1001, "label": ">1000", "color": "#8A0808"},
            {
     "max": 1000, "min": 500, "label": "500-1000", "color": "#B40404"},
            {
     "max": 499, "min": 108, "label": "100-499", "color": "#DF0101"},
            {
     "max": 99, "min": 10, "label": '10-99', "color": "#F78181"},
            {
     "max": 9, "min": 1, "label": "1-9", "color": "#F5A9A9"},
            {
     "max": 0, "min": 0, "label": "0", "color": "#FFFFFF"},
        ],
        textstyle_opts=opts.TextStyleOpts(
            color='white'
        )
    )
)

# 4、设置系列配置
map_world.set_series_opts(
    label_opts=opts.LabelOpts(
        is_show=False,
    )
)

# ===================================================================组合中国地图、世界地图 ==========================================


# 1、实例化对象
grid = Grid(
    init_opts=opts.InitOpts(
        width='1200px',
        height='1600px',
        theme=ThemeType.PURPLE_PASSION
    )
)
# 2、添加数据
grid.add(
    chart=map_china,  # 图表
    grid_opts=opts.GridOpts(
        pos_top='3%',
        height='30%',
    ),
    grid_index=0,
    is_control_axis_index=True
)

grid.add(
    chart=map_world,
    grid_opts=opts.GridOpts(
        pos_top='40%',
        height='50%',
    ),
    grid_index=1,
    is_control_axis_index=True
)

# 3、生成文件
grid.render('./组合中国地图、世界地图.html')

# 顺序多图
# 1、实例化对象
page = Page(
    page_title='组合中国地图、世界地图',  # 网页名称
    interval=0,  # 图例间隔
    layout=Page.DraggablePageLayout
)
# 2、t添加数据
page.add(map_china)
page.add(map_world)
#
# # 3、生成文件
page.render("./组合中国地图、世界地图.html")
