机器人路径规划算法(Dijkstra和A*两种)附带matlab代码
摘要:本文针对机器人路径规划提出了两种算法,分析了基于栅格地图的Dijkstra算法和A算法的不同之处,通过栅格法对机器人运动环境进行建模,最后在Matlab上将Dijkstra算法和A算法进行仿真比较,对比他们的搜索速度、效率以及规划结果,来验证所分析的正确性。
关键词:栅格地图、Dijkstra、A*
一. 引言
路径规划算法的研究是移动机器人研究领域中一个重要的组成部分,它的目的是使移动机器人能够在一个已知或者未知的环境中,找到一条从其实状态到目标状态的无碰撞路径。传统的路径规划算法大部分只考虑机器人的位姿空间,然而,实际上机器人不仅受到位姿空间的约束,还会受到各种外力的约束。路径规划技术作为移动机器人的导航技术甚至是整个移动机器人技术的重要核心技术,也更加受到广大研究学者的关注。
最短路径问题是图论中网络分析的经典问题,近年来,随着路径搜索技术的不断发展,已经涌现出很多成熟的路径规划算法,静态地图搜索算法通常分为盲目搜索算法和启发式搜索算法。最经典的盲目搜索算法是Dijkstra 算法,非常适合在带权有向图中求解最短路径问题,但是由于Dijkstra算法的搜索范围很大,算法效率比较低,因此在实际应用时受到了很大的限制。A算法是一种启发式搜索,作为人工智能领域的重要组成部分,其针对网格数据有着更高的运算效率,而且利用启发式信息大幅度提高搜索速度。
本文针对在已经建立的栅格地图下,分别应用Dijkstra算法和A算法来求解机器人路径的解。分析各自的优缺点和性能,最后在Matlab平台上运行仿真,得出在某一个地图下的路径,验证分析的正确性。
二. 问题描述
移动机器人路径规划是指在一个未知的环境中,机器人根据任务寻找一条最优的运动轨迹,该轨迹可以连接起点和目标点,同时避开环境中的障碍物,归纳起来分为下面两个步骤:
- 地图模型的建立:根据机器人运动的环境然后抽象建立起栅格地图、
- 路径搜索算法:机器人路径规划主要涉及3大问题:①明确起点位置以及终点;②规避障碍物;③尽可能做到路径上的优化。本文将从Dijkstra和A*算法实现路径规划的问题。
三. 算法介绍
3.1 Dijkstra算法原理:
Dijkstra算法采用的是一种贪心的策略,声明一个数组dis来保存源点到各个顶点的最短距离和一个保存已经找到了最短路径的顶点集合:T,初始时,原点s的路径权重被赋予0,对顶点s能够到达直接到达的边(s,m),则把dis[m]设为w(s,m),同时把所有其他不能到达的顶点路径长度设为无穷大;同时初始时集合T只有s。然后,从dis数组选择最小值,则该值就是源点s到该值对应的顶点最短路径,并且把改点加入到T中,然后需要看看新加入的顶点是否可以到达其他顶点并且看看通过该顶点到达其他点的路径是否比源点直接到达短,如果是,那么就替换这些顶点在dis中的值。然后,又从dis中找出最小值,重复上述动作,直到T中包含了图的所有顶点。
3.2 Dijkstra算法步骤

3.3 A*算法原理:
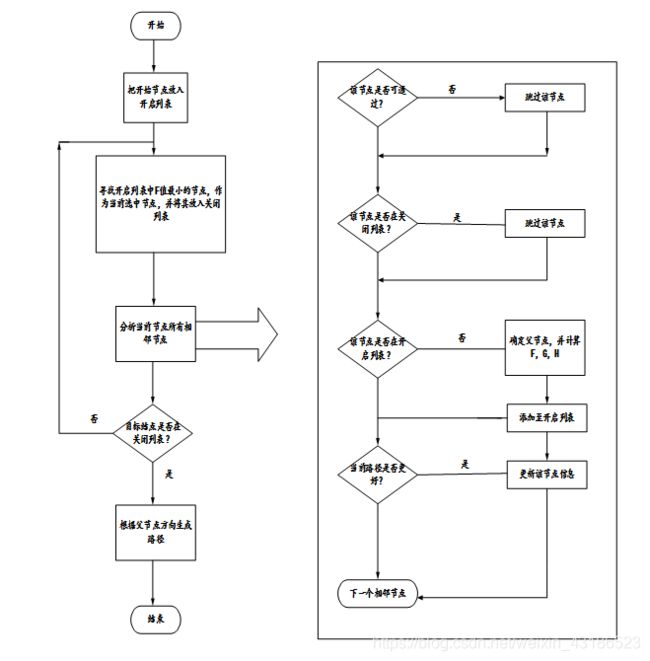
搜索区域被划分为了简单的二维数组,数组中每个元素对应一个小方格,我们将路径规划过程中待检测的格子存放于Open List中,而已检测过的格子存放于Close List中。由F=G+H确定往哪一个格子移动,其中的G代表从初始位置A沿着已生成的路径到待检测的格子的开销,H指待检测格子到目标点的估计移动开销(忽略障碍物)。
3.4算法步骤:

1.把起始格添加到开启列表。
2.重复如下的工作:
a) 寻找开启列表中F值最低的格子。我们称它为当前格。
b) 把它切换到关闭列表。
c) 对相邻的8格中的每一个?
- 如果它不可通过或者已经在关闭列表中,略过它。反之如下。
- 如果它不在开启列表中,把它添加进去。把当前格作为这一格的父节点。记录这一格的F,G,和H值。
- 如果它已经在开启列表中,用G值为参考检查新的路径是否更好。更低的G值意味着更好的路径。如果是这样,就把这一格的父节点改成当前格,并且重新计算这一格的G和F值。如果你保持你的开启列表按F值排序,改变之后你可能需要重新对开启列表排序。
d) 停止,当你把目标格添加进了开启列表,这时候路径被找到,或者没有找到目标格,开启列表已经空了.这时候,路径不存在。
- 保存路径: 从目标格开始,沿着每一格的父节点移动直到回到起始格算法区别:Dijkstra算法计算源点到其他所有点的最短路径长度,A关注点到点的最短路径(包括具体路径)。
四. 仿真:
Dijkstra伪代码
1.For each node n in the graph
n.distance=Infinity
2.Create an empty list.
3.Start.distance=0,add start to list.
4.While list not empty
(1)Let current =node in the list with the smallest distance, remove Current
from list
(2)For each node, n that is adjacent to current
If n.distance>current.distance+length of edge from n to current
n.distance=current.distance+length of edge from n to current
n.parent=current
add n to list if it isn’t there already

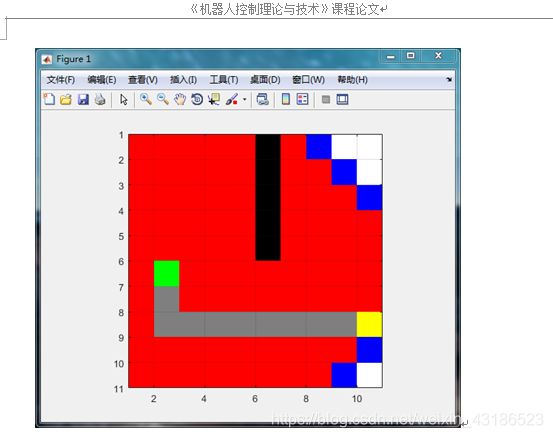
上述的黑色代表障碍物,绿色是起始点,黄色是终点,红色代表Closed列表,蓝色代表Open列表。
从图中我们可以看到Dijkstra从开始点向它的连接线扩散,随着它向更远的节点扩散,它记录来自的方向,最终抵达目标点并根据箭头返回到开始点来生成完整的路径,进行迭代时,每一次迭代它考虑图中的一个节点并且跟随以它扩散的连接。标准的Dijkstra算法在Open列表为空时结束,即已经考虑了从开始节点延伸的所有节点,并且它们都处于Closed列表,但实际中,这个规则经常被打破,第一次发现目标节点的路径常常是最短路径,基于这种情况,实现的寻路算法中一旦遇到目标结点,便立即结束寻路。
A伪代码:
1.For each node n in the graph
n.f=Infinity, n.g=Infinity
2.Create an empty list.
3.Strat.g=0,start.f=H(start) add start to list.
4.While list not empty
(1)Let current=node in the list with the smallest f value,remove current from list
(2)If(current==goal node) report success
(3)For each node, n that is adjacent to current
If(n.g>(current.g+cost of edge from n to current))
n.g=current.g+cost of edge from n to current
n.f=n.g+H(n)
n.parent=current
add n to list if isn’t there already

上述的黑色代表障碍物,绿色是起始点,黄色是终点,红色代表Closed列表,蓝色代表Open列表。
A算法和Dijkstra一样的方式工作,但是不是在Open列表中选取最小的cost-so-far节点,而是选取以更可能短距离到达目标点的节点。“更可能”通过一个启发式方法来操作。如果这个启发式方法很精确,那么A算法很精确,否则就会比Dijkstra更差
五. 总结
对比Dijkstra和A算法,我们知道二者计算最短路径时常用的方法,两种算法也各有特点:
1.Dijkstra算法计算源点到其他所有点的最短路径长度,A关注点到点最短路径(包括具体路径)。
2.Dijkstra算法建立在较为抽象的图论层面,A算法可以更轻松地用在诸如游戏地图寻路中。
3.Dijkstra算法的实质是广度优先搜索,是一种发散式的搜索,所以空间复杂度和时间复杂度都比较高。对路径上的当前点,A算法不但记录其到源点的代价,还计算当前点到目标点的期望代价,是一种启发式算法,也可以认为是一种深度优先的算法。
4.由第1点知,当目标点很多时,A*算法会带入大量重复数据和复杂的估价函数,所以如果不要求获得具体路径而只比较路径长度时,Dijkstra算法会成为更好的选择。
Matlab代码 如下
A*
function [route,numExpanded] = AStarGrid (input_map, start_coords, dest_coords)
% Run A* algorithm on a grid.
% Inputs :
%   input_map : a logical array where the freespace cells are false or 0 and
%   the obstacles are true or 1
%   start_coords and dest_coords : Coordinates of the start and end cell
%   respectively, the first entry is the row and the second the column.
% Output :
%    route : An array containing the linear indices of the cells along the
%    shortest route from start to dest or an empty array if there is no
%    route. This is a single dimensional vector
%    numExpanded: Remember to also return the total number of nodes
%    expanded during your search. Do not count the goal node as an expanded node.

% set up color map for display用一个map矩阵来表示每个点的状态
% 1 - white - clear cell
% 2 - black - obstacle
% 3 - red = visited 相当于CLOSED列表的作用
% 4 - blue  - on list 相当于OPEN列表的作用
% 5 - green - start
% 6 - yellow - destination

cmap = [1 1 1; ...
    0 0 0; ...
    1 0 0; ...
    0 0 1; ...
    0 1 0; ...
    1 1 0; ...
    0.5 0.5 0.5];

colormap(cmap);

% variable to control if the map is being visualized on every
% iteration
drawMapEveryTime = true;

[nrows, ncols] = size(input_map);

% map - a table that keeps track of the state of each grid cell用来上色的
map = zeros(nrows,ncols);

map(~input_map) = 1;   % Mark free cells
map(input_map)  = 2;   % Mark obstacle cells

% Generate linear indices of start and dest nodes将下标转换为线性的索引值
start_node = sub2ind(size(map), start_coords(1), start_coords(2));
dest_node  = sub2ind(size(map), dest_coords(1),  dest_coords(2));

map(start_node) = 5;
map(dest_node)  = 6;

% meshgrid will `replicate grid vectors' nrows and ncols to produce
% a full grid
% type `help meshgrid' in the Matlab command prompt for more information
parent = zeros(nrows,ncols);%用来记录每个节点的父节点

%
[X, Y] = meshgrid (1:ncols, 1:nrows);

xd = dest_coords(1);
yd = dest_coords(2);

% Evaluate Heuristic function, H, for each grid cell
% Manhattan distance用曼哈顿距离作为启发式函数
H = abs(X - xd) + abs(Y - yd);
H = H';
% Initialize cost arrays
f = Inf(nrows,ncols);
g = Inf(nrows,ncols);

g(start_node) = 0;
f(start_node) = H(start_node);

% keep track of the number of nodes that are expanded
numExpanded = 0;

% Main Loop

while true

    % Draw current map
    map(start_node) = 5;
    map(dest_node) = 6;

    % make drawMapEveryTime = true if you want to see how the
    % nodes are expanded on the grid.
    if (drawMapEveryTime)
        image(1.5, 1.5, map);
        grid on;
        axis image;
        drawnow;
    end

    % Find the node with the minimum f value,其中的current是index值,需要转换
    [min_f, current] = min(f(:));

    if ((current == dest_node) || isinf(min_f))
        break;
    end;

    % Update input_map
    map(current) = 3;
    f(current) = Inf; % remove this node from further consideration
    numExpanded=numExpanded+1;
    % Compute row, column coordinates of current node
    [i, j] = ind2sub(size(f), current);

    % *********************************************************************
    % ALL YOUR CODE BETWEEN THESE LINES OF STARS
    % Visit all of the neighbors around the current node and update the
    % entries in the map, f, g and parent arrays
    %
    action=[-1 0; 1 0; 0 -1; 0 1];%上,下,左,右
    for a=1:4
        expand=[i,j]+action(a,:);
        expand1=expand(1,1);
        expand2=expand(1,2);
        %不超出边界,不穿越障碍,不在CLOSED列表里,也不是起点,则进行扩展
        if ( expand1>=1 && expand1<=10 && expand2>=1 && expand2<=10 && map(expand1,expand2)~=2 && map(expand1,expand2)~=3 && map(expand1,expand2)~=5)
            if ( g(expand1,expand2)> g(i,j)+1 )
                g(expand1,expand2)= g(i,j)+1;
                f(expand1,expand2)= g(expand1,expand2)+H(expand1,expand2);
                parent(expand1,expand2)=current;
                map(expand1,expand2)=4;
            end
        end
    end
    %*********************************************************************


end

%% Construct route from start to dest by following the parent links
if (isinf(f(dest_node)))
    route = [];
else
    route = [dest_node];

    while (parent(route(1)) ~= 0)
        route = [parent(route(1)), route];
    end

    % Snippet of code used to visualize the map and the path
    for k = 2:length(route) - 1
        map(route(k)) = 7;
        pause(0.1);
        image(1.5, 1.5, map);
        grid on;
        axis image;
    end
end

end
Dijkstra
function [route,numExpanded] = DijkstraGrid (input_map, start_coords, dest_coords)
% Run Dijkstra's algorithm on a grid.
% Inputs :
%   input_map : a logical array where the freespace cells are false or 0 and
%   the obstacles are true or 1
%   start_coords and dest_coords : Coordinates of the start and end cell
%   respectively, the first entry is the row and the second the column.
% Output :
%    route : An array containing the linear indices of the cells along the
%    shortest route from start to dest or an empty array if there is no
%    route. This is a single dimensional vector
%    numExpanded: Remember to also return the total number of nodes
%    expanded during your search. Do not count the goal node as an expanded node.


% set up color map for display
% 1 - white - clear cell
% 2 - black - obstacle
% 3 - red = visited
% 4 - blue  - on list
% 5 - green - start
% 6 - yellow - destination

cmap = [1 1 1; ...
        0 0 0; ...
        1 0 0; ...
        0 0 1; ...
        0 1 0; ...
        1 1 0; ...
	0.5 0.5 0.5];

colormap(cmap);

% variable to control if the map is being visualized on every
% iteration
drawMapEveryTime = true;

[nrows, ncols] = size(input_map);

% map - a table that keeps track of the state of each grid cell
map = zeros(nrows,ncols);

map(~input_map) = 1;   % Mark free cells
map(input_map)  = 2;   % Mark obstacle cells

% Generate linear indices of start and dest nodes
start_node = sub2ind(size(map), start_coords(1), start_coords(2));
dest_node  = sub2ind(size(map), dest_coords(1),  dest_coords(2));

map(start_node) = 5;
map(dest_node)  = 6;

% Initialize distance array
distanceFromStart = Inf(nrows,ncols);

% For each grid cell this array holds the index of its parent
parent = zeros(nrows,ncols);

distanceFromStart(start_node) = 0;

% keep track of number of nodes expanded
numExpanded = 0;

% Main Loop
while true

    % Draw current map
    map(start_node) = 5;
    map(dest_node) = 6;

    % make drawMapEveryTime = true if you want to see how the
    % nodes are expanded on the grid.
    if (drawMapEveryTime)
        image(1.5, 1.5, map);
        grid on;
        axis image;
        drawnow;
    end

    % Find the node with the minimum distance
    [min_dist, current] = min(distanceFromStart(:));

    if ((current == dest_node) || isinf(min_dist))
        break;
    end;

    % Update map
    map(current) = 3;         % mark current node as visited
    numExpanded=numExpanded+1;
    % Compute row, column coordinates of current node
    [i, j] = ind2sub(size(distanceFromStart), current);

   % *********************************************************************
    % YOUR CODE BETWEEN THESE LINES OF STARS

    % Visit each neighbor of the current node and update the map, distances
    % and parent tables appropriately.
    action=[-1 0; 1 0; 0 -1; 0 1];%上,下,左,右
    for a=1:4
        expand=[i,j]+action(a,:);
        expand1=expand(1,1);
        expand2=expand(1,2);
        %不超出边界,不穿越障碍,不在CLOSED列表里,则进行扩展
        if ( expand1>=1 && expand1<=10 && expand2>=1 && expand2<=10 && map(expand1,expand2)~=2 && map(expand1,expand2)~=3 && map(expand1,expand2)~=5 )
            if ( distanceFromStart(expand1,expand2)> distanceFromStart(i,j)+1 )
                distanceFromStart(expand1,expand2)= distanceFromStart(i,j)+1;
                parent(expand1,expand2)=current;
                map(expand1,expand2)=4;
            end
        end
    end
    distanceFromStart(current) = Inf; % remove this node from further consideration
    %*********************************************************************

end

%% Construct route from start to dest by following the parent links
if (isinf(distanceFromStart(dest_node)))
    route = [];
else
    route = [dest_node];

    while (parent(route(1)) ~= 0)
        route = [parent(route(1)), route];
    end

        % Snippet of code used to visualize the map and the path
    for k = 2:length(route) - 1
        map(route(k)) = 7;
        pause(0.1);
        image(1.5, 1.5, map);
        grid on;
        axis image;
    end
end

end
测试代码
 %
% TestScript for Assignment 1
%

%% Define a small map
map = false(10);

% Add an obstacle
map (1:5, 6) = true;

start_coords = [6, 2];
dest_coords  = [8, 10];

%%
close all;
 %[route, numExpanded] = DijkstraGrid (map, start_coords, dest_coords);
% Uncomment following line to run Astar
 [route, numExpanded] = AStarGrid (map, start_coords, dest_coords);

%HINT: With default start and destination coordinates defined above, numExpanded for Dijkstras should be 76, numExpanded for Astar should be 23.
以上代码借鉴了一些文章,仅供学习交流