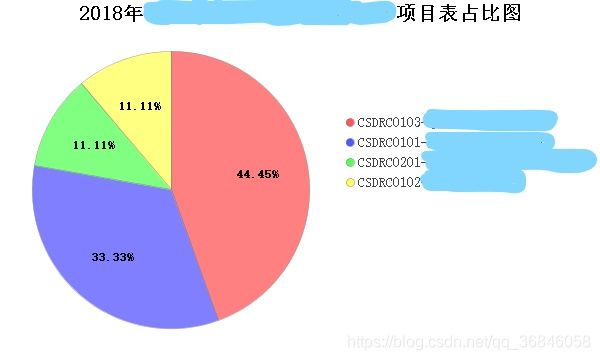
JfreeChart生成饼图,百分比在饼里,文字居右等
public class HelloWorld {
public static void main(String[] args) {
double[ ] data ={10,20,35,25,10} ;
String[ ] keys={“苹果”,“李果”,“杨梅”,“梨子”,“香蕉”} ;
createValidityComparePimChar(getDataPieSetByUtil(data, keys), “理财分红占比图”,“分红图片”.png",keys);
}
}
//判断文件夹是否存在,如果不存在则新建
private void isChartPathExist(String chartPath) {
File file = new File(chartPath);
if (!file.exists()) {
file.mkdirs();
}
}
/**
* 饼状图
* @param dataset 数据集
* @param chartTitle 图标题
* @param charName 生成图的名字
* @param pieKeys 分饼的名字集
* @return
*/
public String createValidityComparePimChar(PieDataset dataset,
String chartTitle, String charName, String[] pieKeys) {
	// chart:图标标题、 data:数据、true:是显示图列、false:否显示工具提示、false否生成url
 JFreeChart chart = ChartFactory.createPieChart(chartTitle, dataset,  true,false, false);

 // 使下说明标签字体清晰,去锯齿类似chart.getRenderingHints().put(RenderingHints.KEY_TEXT_ANTIALIASING,RenderingHints.VALUE_TEXT_ANTIALIAS_OFF);的效果
 chart.setTextAntiAlias(false);
 chart.setBackgroundPaint(Color.white);   // 图片背景色

 // 设置图标题的字体重新设置title
 Font font = new Font("宋体", Font.BOLD, 20);
 TextTitle title = new TextTitle(chartTitle);
 title.setFont(font);
 chart.setTitle(title);
 PiePlot plot = (PiePlot) chart.getPlot();
legendTitle legendTitle = new LegendTitle(plot);//创建图例
legendTitle.setPosition(RectangleEdge.RIGHT); //设置图例的位置
 // 指定饼图轮廓线的颜色
 // plot.setBaseSectionOutlinePaint(Color.BLACK);
 // plot.setBaseSectionPaint(Color.BLACK);

 chart.getLegend().setVisible(true);
 chart.getLegend().setPosition(RectangleEdge.RIGHT);//饼图文字居右显示
 chart.getLegend().setItemFont(new Font("宋体",0,14));
 chart.getLegend().setBackgroundPaint(Color.WHITE);
 chart.getLegend().setFrame(new BlockBorder(Color.WHITE));//设置饼图右边文字边框为白色,就可以达到隐藏边框的效果
chart.getLegend().setHorizontalAlignment(HorizontalAlignment.CENTER);//设置水平对齐 左对齐;
chart.getLegend().setMargin(0,0,0,0);//参数是:上,左,下,右. 设置饼图的位置
chart.getLegend().setPadding(0, 0, 80, 0);// 设置饼图右边文字的位置
chart.getLegend().setFrame(new BlockBorder(0,0,0,0));// 设置饼图右边文字边框的位置
plot.setNoDataMessage(“无对应的数据,请重新查询。”); // 设置无数据时的信息
plot.setNoDataMessagePaint(Color.blue); // 设置无数据时的信息显示颜色
// 图片中显示百分比:自定义方式,{0} 表示选项, {1} 表示数值, {2} 表示所占比例 ,小数点后两位
plot.setLabelGenerator(new StandardPieSectionLabelGenerator("{2}", NumberFormat.getNumberInstance(),new DecimalFormat(“0.00%”)));
// 图例显示百分比:自定义方式, {0} 表示选项, {1} 表示数值, {2} 表示所占比例
plot.setLegendLabelGenerator(new StandardPieSectionLabelGenerator("{0}"));//饼图左边文字
// plot.setToolTipGenerator(new StandardPieToolTipGenerator()); //设置鼠标悬停提示
plot.setLabelFont(new Font(“宋体”,Font.BOLD, 12));
plot.setBackgroundPaint(Color.white); //饼图背景色
plot.setOutlinePaint(Color.WHITE);// 设置绘图面板外边的填充颜色
plot.setShadowPaint(Color.WHITE);// 设置绘图面板阴影的填充颜色
plot.setLabelLinksVisible(true);//设置每块饼和数据之间的线
chart.setBackgroundPaint(new Color(253,253,253));
plot.setSectionOutlinesVisible(false);//是否显示分界线
plot.setSimpleLabels(true);//设置简单标签
plot.setMaximumLabelWidth(0.25D);//设置标签最长宽度
plot.setLabelLinkMargin(0.05D); // 设置分类标签与图的连接线边距
plot.setIgnoreZeroValues(true);// 忽略无值的分类
plot.setLabelGap(0.00D);// 设置饼与边框的距离
 //下面设置的是:饼图里面的百分比去除标签边框,只显示百分比的数据 (4个都要设置,缺一不可)
 plot.setLabelOutlinePaint(null);// (1)自定义标签产生器,设置绘图面板外边的填充颜色
 plot.setLabelShadowPaint(null);//自定义标签产生器, 设置绘图面板阴影的填充颜色
 plot.setLabelOutlineStroke(null);//(2) 自定义标签产生器,设置绘图面板外边的填充颜色
 plot.setLabelBackgroundPaint(null);//自定义标签产生器,背景色
 //上面设置的是:饼图里面的百分比去除标签边框,只显示百分比的数据
// plot.setBackgroundAlpha(1f);
plot.setForegroundAlpha(0.75f); // 指定图片的前景透明度(0.0-1.0)
plot.setCircular(true, false); // 指定显示的饼图上圆形(false)还椭圆形(true)
// plot.setStartAngle(90); // 设置第一个 饼块section 的开始位置,默认是12点钟方向
// 设置分饼颜色
// plot.setSectionPaint(pieKeys[0], new Color(244, 194, 144));
// plot.setSectionPaint(pieKeys[1], new Color(144, 233, 144));
 FileOutputStream fos_jpg = null;
 try {
  // 文件夹不存在则创建
  isChartPathExist(CHART_PATH);
  String chartName = CHART_PATH + charName;
  fos_jpg = new FileOutputStream(chartName);
  // 高宽的设置影响椭圆饼图的形状
  ChartUtilities.writeChartAsPNG(fos_jpg, chart, 600, 360);
  return chartName;

 } catch (Exception e) {
  e.printStackTrace();
  return null;
 } finally {
  try {
	  fos_jpg.close();
  } catch (Exception e) {
   e.printStackTrace();
  }
}
}
