线性回归实现及模型评估
目录
简单线性回归
多元线性回归
线性回归模型评估
线性回归通常是人们在学习预测模型时首选的技术之一,在这种技术中,因变量是连续的,自变量可以是连续的也可以是离散的,回归线的性质是线性的。
线性回归使用最佳的拟合直线(也就是回归线)在因变量(Y)和一个或多个自变量(X)之间建立一种关系。
主要有有简单线性回归 / 多元线性回归
导入常见模块
import numpy as np
import pandas as pd
import matplotlib.pyplot as plt
简单线性回归
from sklearn.linear_model import LinearRegression
# 导入线性回归模块

rng = np.random.RandomState(2)
xtrain =10*rng.rand(30)
ytrain = 8 + 4*xtrain + rng.rand(30)
#np.random.RandomState ->随机数种子,对于一个随机数发生器,只要该种子相同,产生的随机数序列就是相同的
# 生成随机数据x与y
# 样本关系:y = 8 + 4*x

fig = plt.figure(figsize=(12,3))
ax1 = fig.add_subplot(1,2,1)
plt.scatter(xtrain,ytrain,marker='.',color='K')
plt.grid()
plt.title('Sample data charts')
#生成散点图
#xtrain[:,np.newaxis]

model = LinearRegression()
model.fit(xtrain[:,np.newaxis],ytrain)

print(model.coef_) #拟合斜率
print(model.intercept_) #拟合截距
#拟合曲线 y = 3.99x + 8.53

xtest = np.linspace(0,10,1000)
ytest = model.predict(xtest[:,np.newaxis])

ax2 = fig.add_subplot(1,2,2)
plt.scatter(xtrain,ytrain,marker='.',color='K')
plt.plot(xtest,ytest,color = 'r')
plt.grid()
plt.ylim(10,40)
plt.title('Predict data chart')
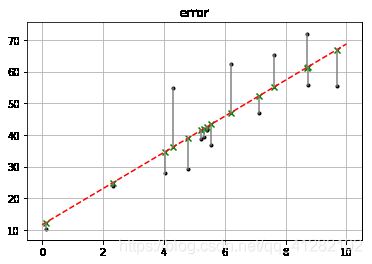
误差
# 误差
rng = np.random.RandomState(8)
xtrain = 10 * rng.rand(15)
ytrain = 8 + 4 * xtrain + rng.rand(15)*30
model.fit(xtrain[:,np.newaxis],ytrain)
xtest = np.linspace(0,10,1000)
ytest = model.predict(xtest[:,np.newaxis])
#创建岩本数据并进行拟合

plt.plot(xtest,ytest,color = 'r',linestyle = '--') # 拟合直线
plt.scatter(xtrain,ytrain,marker='.',color = 'k') #样本数据散点图
ytest2 = model.predict(xtrain[:,np.newaxis]) #样本数据x在拟合直线上的y值
plt.scatter(xtrain,ytest2,marker='x',color='g') # ytest2的散点图
plt.plot([xtrain,xtrain],[ytrain,ytest2],color = 'gray') # 误差线
plt.grid()
plt.title('error') #误差
多元线性回归
rng = np.random.RandomState(5)
xtrain = 10 * rng.rand(150,4)
ytrain = 20 + np.dot(xtrain,[1.5,2,-4,3]) + rng.rand(150) #np.dot() 内积
df = pd.DataFrame(xtrain,columns=['b1','b2','b3','b4'])
df['y'] = ytrain

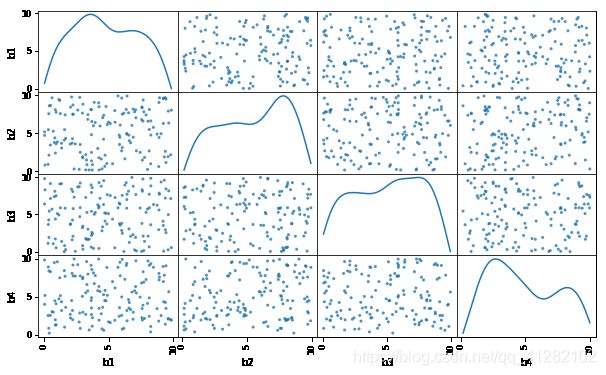
pd.scatter_matrix(df[['b1','b2','b3','b4']],figsize=(10,6),diagonal='kde',alpha=0.8,range_padding=0.1) #查看多元变量之间是否存在线性相关
model = LinearRegression()
model.fit(df[['b1','b2','b3','b4']],df['y'])
print('斜率a为:',model.coef_)
print('截距b为:%.4f'%model.intercept_)
print('线性回归函数为:/ny = %.1fx1 + %.1fx2 + %.1fx3 + %.1fx4 + %.1f'%(model.coef_[0],model.coef_[1],model.coef_[2],model.coef_[3],model.intercept_))
斜率a为: [ 1.501989 1.99186894 -4.00453124 3.00278851] 截距b为:20.5319 线性回归函数为:/ny = 1.5x1 + 2.0x2 + -4.0x3 + 3.0x4 + 20.5观察多元变量之间有无线性关系
线性回归模型评估
评估参数主要有
SSE(和方差,误差平方和)
拟合数据和原始数据对应点的误差平方和
MSE(均方差)
预测数据和原始数据误差平方和的均值,SSE/n
RMSE(均方根)
MSE的平方根
R-square(确定系数)
1.SSR:预测数据与原始数据的均值之差的平方和
2.SST:原始数据与原始数据的均值之差的平方和R-square是SSR与SST的比值,越接近1表示拟合能力越强
#模型评价
# MSE,RMSE,R-square

from sklearn import metrics

rng = np.random.RandomState(1)
xtrain = 10*rng.rand(30)
ytrain = 8 + 4*xtrain + rng.rand(30)*3
#创建数据

model = LinearRegression()
model.fit(xtrain[:,np.newaxis],ytrain)
#多元回归拟合

ytest = model.predict(xtrain[:,np.newaxis])#求出预测数据
mse = metrics.mean_squared_error(ytrain,ytest)#求出均方差
rmse = np.sqrt(mse) #求出均方根

ssr = ((ytest - ytrain.mean())**2).sum() #求出预测数据与原始数据均值之差的平方和
sst = ((ytrain - ytrain.mean())**2).sum()#求出原始数据和均值之差的平方和
rsq = ssr/sst #求出确定系数
print(rsq)
#0.9946452159695

rsq2 = model.score(xtrain[:,np.newaxis],ytrain)#两种方法所求r-square值一样
print(rq2)
#0.9946452159694995


