Python数据分析练习:北京、广州PM2.5空气质量分析(2)
<接上一篇>
In [18]:
gz2015_grade = df_gz2015.groupby(['Grade']).size()/len(df_gz2015)
In [19]:
gz2016_grade = df_gz2016.groupby(['Grade']).size()/len(df_gz2016)
In [20]:
bj2015_grade = df_bj2015.groupby(['Grade']).size()/len(df_bj2015)
In [21]:
bj2016_grade = df_bj2016.groupby(['Grade']).size()/len(df_bj2016)
In [22]:
# 定义一个空气质量等级索引
ix_grade = ['Good', 'Moderate', 'Unhealthy for Sensi', 'Unhealthy', 'Very Unhealthy', 'Hazardous','Beyond Index']
In [23]:
# 创建一个DataFrame对象,先把广州2015年的空气质量等级占比数据加进去
df_grade = pd.DataFrame(gz2015_grade, index = ix_grade, columns=['gz2015'])
In [24]:
# 接下来把其他三个等级数据也加进DataFrame中
df_grade['gz2016'] = gz2016_grade
df_grade['bj2015'] = bj2015_grade
df_grade['bj2016'] = bj2016_grade
In [25]:
# 查看我们获得的DataFrame,这里包含了两地两年的空气质量等级占比数据
df_grade
Out[25]:
In [26]:
# 使用饼图查看广州2016年空气质量等级占比
df_grade.ix[:,'gz2016'].plot.pie(title = 'Guangzhou 2016 AQI' ,autopct = '%.1f%%', fontsize = 12, figsize=(6,6))
Out[26]:
In [27]:
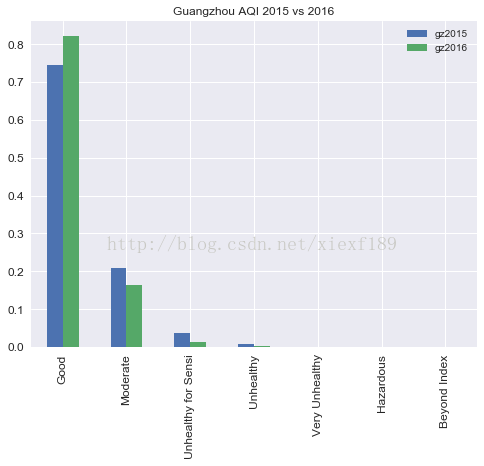
df_grade.ix[:,['gz2015','gz2016']].plot.bar(title='Guangzhou AQI 2015 vs 2016', figsize=(8,6),fontsize = 12 )
Out[27]:
In [28]:
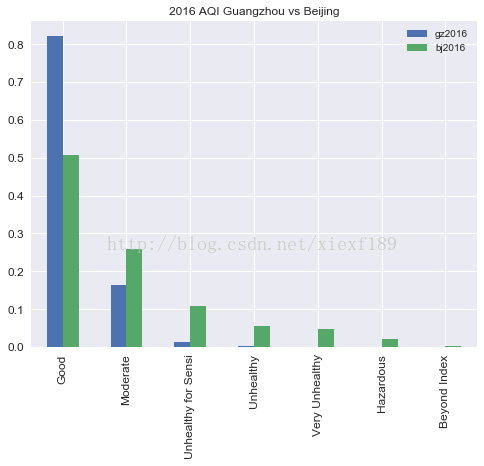
df_grade.ix[:,['gz2016','bj2016']].plot.bar(title='2016 AQI Guangzhou vs Beijing', figsize=(8,6),fontsize = 12)
Out[28]:
In [29]:
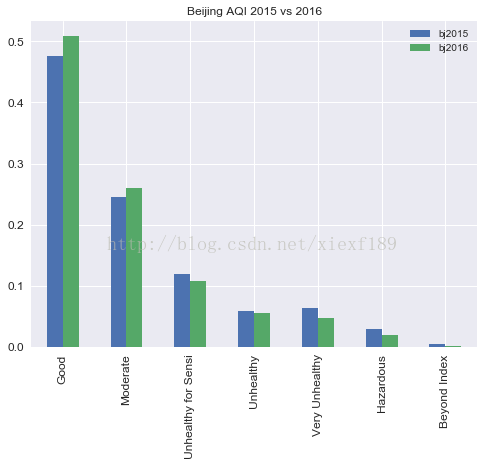
df_grade.ix[:,['bj2015','bj2016']].plot.bar(title='Beijing AQI 2015 vs 2016', figsize=(8,6),fontsize = 12)
Out[29]:
In [30]:
# 计算两地两年的pm2.5测量值月度平均值
gz2015_month = df_gz2015.groupby(['Month'])['Value'].mean()
gz2016_month = df_gz2016.groupby(['Month'])['Value'].mean()
bj2015_month = df_bj2015.groupby(['Month'])['Value'].mean()
bj2016_month = df_bj2016.groupby(['Month'])['Value'].mean()
In [31]:
df_month = pd.DataFrame({'gz2015':gz2015_month}, index = np.arange(1,13))
In [32]:
df_month['gz2016'] = gz2016_month
df_month['bj2015'] = bj2015_month
df_month['bj2016'] = bj2016_month
In [33]:
df_month
Out[33]:
In [34]:
df_month.ix[:, ['gz2015','gz2016']].plot(title='Guangzhou PM2.5 Monthly Avg. 2015 vs 2016', figsize=(8,4))
Out[34]:
In [35]:
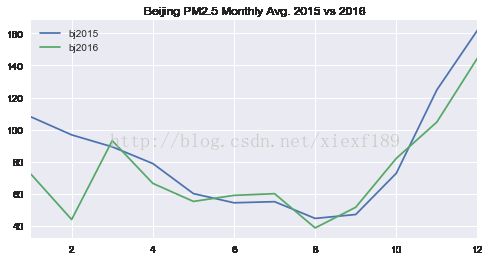
df_month.ix[:, ['bj2015','bj2016']].plot(title='Beijing PM2.5 Monthly Avg. 2015 vs 2016', figsize=(8,4))
Out[35]:
In [36]:
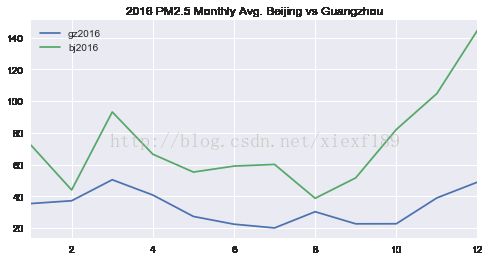
df_month.ix[:, ['gz2016','bj2016']].plot(title='2016 PM2.5 Monthly Avg. Beijing vs Guangzhou', figsize=(8,4))
Out[36]:
In [37]:
df_hour = pd.DataFrame({'Month': df_gz2015.ix[:,'Month'],
                        'Day'  : df_gz2015.ix[:,'Day'],
                        'Hour' : df_gz2015.ix[:,'Hour'],
                        'gz2015':df_gz2015.ix[:,'Value']})
In [38]:
df_hour.describe()
Out[38]:
In [39]:
df_hour = df_hour.merge(df_gz2016.ix[:,['Month','Day','Hour','Value']], on=('Month','Day','Hour'))
In [40]:
df_hour.rename_axis({'Value':'gz2016'}, axis="columns", inplace=True)
In [41]:
df_hour.describe()
Out[41]:
In [42]:
df_hour = df_hour.merge(df_bj2015.ix[:,['Month','Day','Hour','Value']], on=('Month','Day','Hour'))
df_hour.rename_axis({'Value':'bj2015'}, axis="columns", inplace=True)

df_hour = df_hour.merge(df_bj2016.ix[:,['Month','Day','Hour','Value']], on=('Month','Day','Hour'))
df_hour.rename_axis({'Value':'bj2016'}, axis="columns", inplace=True)
In [43]:
df_hour.head()
Out[43]:
In [44]:
df_hour.describe()
Out[44]:
In [45]:
df_hour.head()
Out[45]:
In [46]:
len(df_hour[df_hour['gz2015']>df_hour['gz2016']]), 1.0*len(df_hour[df_hour['gz2015']>df_hour['gz2016']])/len(df_hour)
Out[46]:
In [47]:
len(df_hour[df_hour['gz2015']<df_hour['gz2016']]),1.0*len(df_hour[df_hour['gz2015']<df_hour['gz2016']])/len(df_hour)
Out[47]:
In [48]:
df_hour.ix[:, ['gz2015','gz2016']].plot(title='Guangzhou PM2.5 Hourly 2015 vs 2016', figsize=(12,4))
Out[48]:
In [49]:
len(df_hour[df_hour['bj2016']>df_hour['gz2016']]), 1.0*len(df_hour[df_hour['bj2016']>df_hour['gz2016']])/len(df_hour)
Out[49]:
In [50]:
len(df_hour[df_hour['bj2016']<df_hour['gz2016']]), 1.0*len(df_hour[df_hour['bj2016']<df_hour['gz2016']])/len(df_hour)
Out[50]:
In [51]:
df_hour.ix[:, ['bj2016','gz2016']].plot(title='2016 PM2.5 Hourly Beijing vs Guangzhou', figsize=(12,4))
Out[51]:

