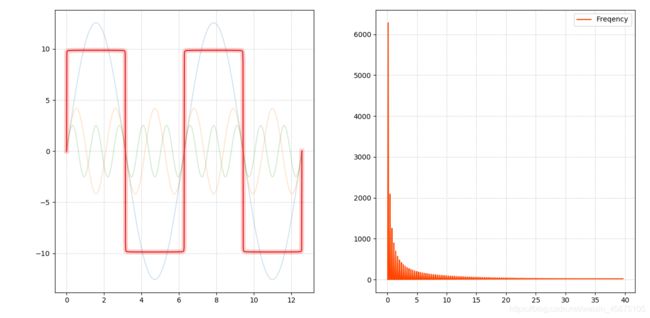
python numpy 傅里叶变换与频域图
"""
三角函数 合成方波
傅里叶变换与逆傅里叶变换
绘制频域图
"""
import numpy as np
import matplotlib.pyplot as mp
import numpy.fft as nf
x = np.linspace(0, np.pi * 4, 1000)
y1 = 4 * np.pi * np.sin(x)
y2 = 4 / 3 * np.pi * np.sin(3 * x)
y3 = 4 / 5 * np.pi * np.sin(5 * x)
n = 1000
y = np.zeros(n)
for i in range(1, n + 1):
y += 4 / (2 * i - 1) * np.pi * np.sin((2 * i - 1) * x)
mp.subplot(121)
mp.grid(linestyle=":")
mp.plot(x, y1, label="y1", alpha=0.2)
mp.plot(x, y2, label="y2", alpha=0.2)
mp.plot(x, y3, label="y3", alpha=0.2)
mp.plot(x, y, label="y")
complex_ary = nf.fft(y)
print(complex_ary.shape, complex_ary.dtype)
y_ = nf.ifft(complex_ary).real
mp.plot(x, y_, label="y_", color="red", linewidth=7, alpha=0.2)
mp.tight_layout()
fft_freq = nf.fftfreq(y_.size, x[1] - x[0])
fft_pow = np.abs(complex_ary)
mp.subplot(122)
mp.grid(linestyle=":")
mp.plot(fft_freq[fft_freq > 0], fft_pow[fft_freq > 0], color="orangered", label="Freqency")
mp.legend()
mp.tight_layout()
mp.show()

