Spark中组件Mllib的学习22之假设检验-卡方检验概念理解
更多代码请见:https://github.com/xubo245/SparkLearning
Spark中组件Mllib的学习之基础概念篇
1解释
参考【4】的博文讲的比较清楚了,只是里面有些错误。
定义
卡方检验就是统计样本的实际观测值与理论推断值之间的偏离程度,实际观测值与理论推断值之间的偏离程度就决定卡方值的大小,卡方值越大,越不符合;卡方值越小,偏差越小,越趋于符合,若两个值完全相等时,卡方值就为0,表明理论值完全符合。
(1)提出原假设:
H0:总体X的分布函数为F(x).
基于皮尔逊的检验统计量:
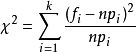
理解:n次试验中样本值落入第i个小区间Ai的频率fi/n与概率pi应很接近,当H0不真时,则fi/n与pi相差很大。在假设成立的情况下服从自由度为k-1的卡方分布。
参考【4】中给了例子,比较好理解,下面是截图:
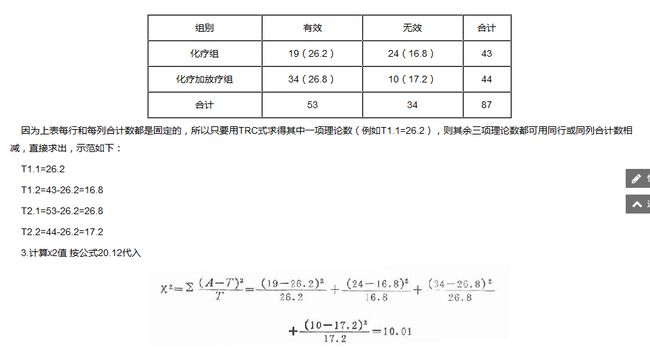
说明:19,34,24,10为实际测量值,括号内为计算值,比如26.2=(53/87)*43
计算卡方检验的值:
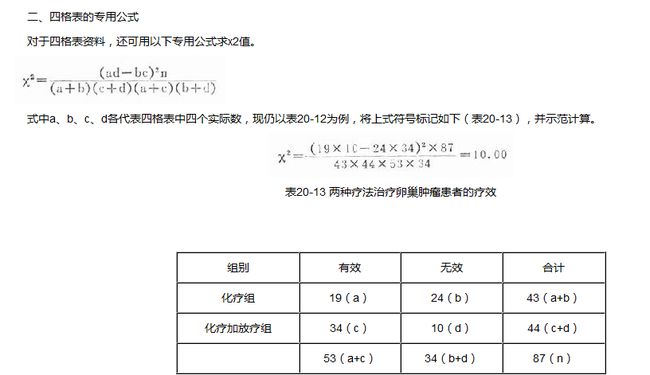
如上图3,也可以是下图专门的计算公式:
p-value确定:具体的没理解,根据参考【4】查表可以知道大概在0.001
【4】中还给出了:“从表20-14可见,T1.2和T2.2数值都<5,且总例数大于40,故宜用校正公式(20.15)检验”,可以去看看
2.代码:
/**
  * @author xubo
  *         ref:Spark MlLib机器学习实战
  *         more code:https://github.com/xubo245/SparkLearning
  *         more blog:http://blog.csdn.net/xubo245
  */
package org.apache.spark.mllib.learning.basic

import org.apache.spark.mllib.linalg.{Matrix, Matrices, Vectors}
import org.apache.spark.mllib.stat.Statistics
import org.apache.spark.{SparkConf, SparkContext}

/**
  * Created by xubo on 2016/5/23.
  */
object ChiSqLearning {
  def main(args: Array[String]) {
    val vd = Vectors.dense(1, 2, 3, 4, 5)
    val vdResult = Statistics.chiSqTest(vd)
    println(vd)
    println(vdResult)
    println("-------------------------------")
    val mtx = Matrices.dense(3, 2, Array(1, 3, 5, 2, 4, 6))
    val mtxResult = Statistics.chiSqTest(mtx)
    println(mtx)
    println(mtxResult)
    //print :方法、自由度、方法的统计量、p值
    println("-------------------------------")
    val mtx2 = Matrices.dense(2, 2, Array(19.0, 34, 24, 10.0))
    printChiSqTest(mtx2)
    printChiSqTest( Matrices.dense(2, 2, Array(26.0, 36, 7, 2.0)))
//    val mtxResult2 = Statistics.chiSqTest(mtx2)
//    println(mtx2)
//    println(mtxResult2)
  }

  def printChiSqTest(matrix: Matrix): Unit = {
    println("-------------------------------")
    val mtxResult2 = Statistics.chiSqTest(matrix)
    println(matrix)
    println(mtxResult2)
  }


}
3.结果:
[1.0,2.0,3.0,4.0,5.0]
Chi squared test summary:
method: pearson
degrees of freedom = 4
statistic = 3.333333333333333
pValue = 0.5036682742334986
No presumption against null hypothesis: observed follows the same distribution as expected..
-------------------------------
1.0  2.0
3.0  4.0
5.0  6.0
Chi squared test summary:
method: pearson
degrees of freedom = 2
statistic = 0.14141414141414144
pValue = 0.931734784568187
No presumption against null hypothesis: the occurrence of the outcomes is statistically independent..
-------------------------------
-------------------------------
19.0  24.0
34.0  10.0
Chi squared test summary:
method: pearson
degrees of freedom = 1
statistic = 9.999815802502738
pValue = 0.0015655588405594223
Very strong presumption against null hypothesis: the occurrence of the outcomes is statistically independent..
-------------------------------
26.0  7.0
36.0  2.0
Chi squared test summary:
method: pearson
degrees of freedom = 1
statistic = 4.05869675818742
pValue = 0.043944401832082036
Strong presumption against null hypothesis: the occurrence of the outcomes is statistically independent..
第四个例子可以用【4】中的校正公式,这里代码没用。
参考
【1】http://spark.apache.org/docs/1.5.2/mllib-guide.html
【2】http://spark.apache.org/docs/1.5.2/programming-guide.html
【3】https://github.com/xubo245/SparkLearning
【4】http://blog.csdn.net/wermnb/article/details/6628555
【5】http://baike.baidu.com/link?url=y1Ryc0tbOLSL4zULGihtY3gXRbJO26FvHw05cfFYZ01V87h9h2gF0Bl2su2uA52TWq4FGnPAblXLX2jQhFRK3K