【FPGA作业】第三章、第四章 DDS正弦信号产生实验及modelsim仿真
三 DDS正弦信号产生实验
3.1 实验目标
- 设计DDS,50MHz的时钟速率,输出波形频率10MHz
- DDS的输出数据格式为2补码,相位累加器32比特,ROM波表尺寸10bit和波形量化比特数10bit
- 首先在signaltap里观察波形的正确性,然后把signaltap的数据导入到matlab,分析频域结果
3.2 实验原理

注意
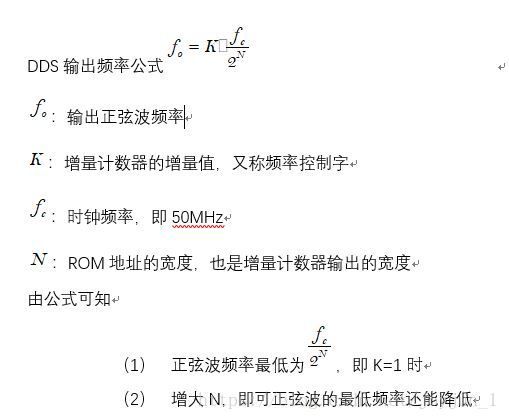
频率控制字K与ROM位数没有关系
1、正弦波波形是可以一段一段曲折拼成的
2、例,频率控制字位数FW_WL=32,ROM地址位数RA_WL=10。加法器输出10位数据,该10位数据这样得出:
acc_R <= #1 fwin_R + acc_R;
addr_R <= acc_R[FW_WL-1:FW_WL-1-(RA_WL-1)];
取的ROM地址是前10位,即一段时间内,ROM表的输出没有变化,最后可以看出是锯齿拼成正弦波
3.3程序matlab与verilog
3.3.1 matlab生成rom代码
(1)生成10bit rom
%假设用到的DA芯片为10,width,对应量化
%正弦波ROM的深度为1024(地址总数),对应采样
%该ROM中数据为一个整周期正弦波1024点采样,每个样点采用10比特量化,数据范围(-1,1),二进制补码格式
%本实验中量化10bit
function []=rom_gen()
depth=1024;
%width=8;
width=10;
%x=ceil(power(2,8)/2*sin(0:pi*2/depth:2*pi))
x=ceil((power(2,width)/2-1)*sin(0:pi*2/depth:2*pi));
fid=fopen('D:\useful\fpga\quaters\basic6\prj6\matlabtest\sine_rom.v','w');

fprintf(fid,'module sine_rom(\n');
fprintf(fid,'    input clk,\n');
fprintf(fid,'    input [9:0] RA,\n');
fprintf(fid,'    output reg[9:0] RD );\n');
fprintf(fid,'always @ (posedge clk)\n');
fprintf(fid,'case(RA)\n');
for k=1:depth
%fprintf(fid,'10''d %d :RD=#1 8''b %d ;\n',k-1,x(k));
fprintf(fid,'10''d %d :RD=#1 10''b %s ;\n',k-1,dec2binPN(x(k),10));
end
fprintf(fid,'default: RD=#1 0;\n');
fprintf(fid,'endcase\n');
fprintf(fid,'endmodule\n');
(2)二进制补码函数 dec2binPN.m
% https://wenku.baidu.com/view/6c477149336c1eb91a375d3a.html
function [numbin]=dec2binPN(numdec, N)
if(numdec>=0)
    numbin1=dec2bin(numdec,N);
else
    numbin1=dec2bin(abs(numdec),N);
    l1=length(numbin1);
    numbin4=0;
    for i=1:l1
        if(numbin1(l1-i+1)==num2str(1))
        %matlab字符串数组s(n):s第n位
        %按位取反,用十进制表示
        numbin4=numbin4+0;
        else
        numbin4=numbin4+power(2,i-1);
        end
    end
    numbin4=numbin4+1;
    numbin1=dec2bin(numbin4,N);
end
numbin=numbin1;
3.3.2 Verilog代码
(1)顶层文件top_sin_wav.v
`timescale 1ns/1ns
module top_sin_wave(
  CLK       ,   // clock, posedge valid
  BUTRST    ,   // reset button
  CLKOUT    ,   // clock output
  SINOUT    );  // DDS sine wave out, to DAC
input CLK;
input BUTRST;
output CLKOUT;
output[9:0]  SINOUT;


wire dds_clkout_W;
wire rst;
wire [9:0]  dds_out_2c_W; // dds output in 2's complement format

parameter VAL_FREQ_BASE=32'd85_899_345;//k = 2 ^ 32 / 50
parameter VAL_FREQ_MAX = (VAL_FREQ_BASE * 10);//50MHZ clk, max 10MHz freqword value

assign rst = BUTRST;

dds_core_sin U_DDS(
  .CLK      (CLK            ),   // clock, posedge valid
  .RST      (rst          ),   // reset, high level reset
  .FWIN     (VAL_FREQ_MAX         ),   // input frequency word
  .CLKOUT   (dds_clkout_W   ),   // output clock
  .SINOUT   (dds_out_2c_W   ));  // sine signal output, 2's complement format

assign SINOUT = dds_out_2c_W;
assign CLKOUT = ~dds_clkout_W;

endmodule // module dds_core
(2)DDS地址增加模块dds_core.v
`timescale 1ns/1ns
module dds_core_sin(
    CLK,    //clock
    RST,    //button reset, high level reset
//  FWEN,   //button frequency word update enable, high level enable
    FWIN,   //input frequency word
    CLKOUT, //output clock
    SINOUT, //sine signal output, 2's complement format
    AccCNT
);

input CLK;
input RST;
//input FWEN;
input[31:0] FWIN;
output CLKOUT;
output[9:0]SINOUT;
output[31:0]AccCNT;

parameter FW_WL=32; // frequency word 32bit
parameter RA_WL=10; // rom address input length
parameter RD_WL=10; // rom data output length

//reg   [FW_WL-1 : 0] fwin_R;   // frequency word
reg [FW_WL-1 : 0] acc_R;    // acc register record frequency + acc
reg [RA_WL-1 : 0] addr_R;   // addr_R related to rom input
reg [RD_WL-1 : 0] sinout_R; // sinout_R is the register of rom output
wire [RD_WL-1 : 0] romout_W;// related to rom output

always @ (posedge CLK ) begin
    if(!RST)
    begin // all registers clear out
//      fwin_R <= 0;
        acc_R <= 0;
        addr_R <= 0;
        sinout_R <= 0;
    end
    else begin
        // fwin_R update
//      if(FWEN) fwin_R <= #5 FWIN;
//      else fwin_R <= #5 fwin_R;
//      fwin_R <= FWIN;
        // acc_R update
//      acc_R <= fwin_R + acc_R;
        acc_R <= FWIN +acc_R;
        // addr_R update, the acc_R high RA_WL is rom address
        addr_R <= acc_R[FW_WL-1 : FW_WL-1 - (RA_WL-1)];

        // sinout_R update
        sinout_R <= romout_W;

    end
end
sine_rom_10bit u_sinrom(
    .rst (RST),
    .clk    (CLK),
    .RA     (addr_R),
    .RD     (romout_W)
);
assign SINOUT = sinout_R;
assign CLKOUT = CLK;
assign AccCNT = acc_R;
endmodule
(3)10bit ROM sine_rom_10bit.v
由matlab函数生成,故略去
// 10bit量化,10bit地址
`timescale 1ns/1ns
module sine_rom_10bit(
    input rst,
    input clk,
    input [9:0] RA,
    output reg[9:0] RD );
always @ (posedge clk)
    if(!rst)
        begin RD=10'd0; end
    else
    begin case(RA)
        10'd 0 :RD=#1 10'b 0000000000 ;
        10'd 1 :RD=#1 10'b 0000000100 ;
        10'd 2 :RD=#1 10'b 0000000111 ;
        10'd 3 :RD=#1 10'b 0000001010 ;
        10'd 4 :RD=#1 10'b 0000001101 ;
``` ```
        10'd 1022 :RD=#1 10'b 1111111010 ;
        10'd 1023 :RD=#1 10'b 1111111101 ;
        default: RD=#1 0;
        endcase
end
endmodule


"se-preview-section-delimiter">
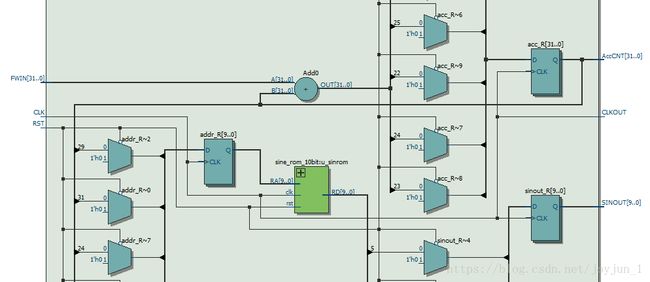
3.4 DDS RTL结构

图3. 1 10MHz正弦波DDS RTL

图3. 2 DDS核心RTL结构
3.5 signaltap抓取图像
3.6 matlab分析
signaltap数据文件为signaltap_data.m,因数据过大,此处略去
(1)matlab主程序check_board_data.m
 signaltap_data;
 signal_len = length(signal_out);
 cfftwinplot(signal_out,50E6,'DDS OUTPUT SPECTRUM', 'red');
(2)matlab绘频谱图函数
% **********************************************************************
% file : cfftwinplot.m
% usuage : complex signal spectrum plot
% author : [email protected]
% date : 2007 Mar 5th
% version : 0.1
% revise history
% 0.1 initial version
% **********************************************************************
function cfftwinplot(data,fs,ttStr,color)
% function cfftwinplot(data,fs,ttStr,color)
% complex signal spectrum viewer
% data : input data sequence
% fs : sample rate
% ttStr : plot title string
% color : Plot colors
dataLen = length(data);
lenLog2 = floor(log2(dataLen)) ;
procLen = 2 ^ lenLog2;
fftLen = procLen;
fftLenMax = 128*1024;
if(fftLen > fftLenMax)
fftLen = fftLenMax;
end
winLen = fftLen;
noverlap = 0;
order = 10;
win = kaiser(winLen, order);
data = data(1:procLen);
[S,W] = pwelch (data, win, noverlap, fftLen);
lenS= length(S);
S = S./max(S);
S = 10*log10(S+1e-15);
% when data is a real signal, S ~ [0, pi]
% copy a symmetric spectrum
if(lenS == ceil((fftLen+1)/2) )
S(lenS) = [];
SRot = S;
SRot = rot90(SRot);
SRot = rot90(SRot);
S = [SRot;S];
else
% data is complex signal, S ~[0~2pi]
S = fftshift(S);
end
N = fftLen;
xvals = linspace(-floor(fs/2), floor(fs/2)-floor((fs/N)), N);
figure;
plot(xvals(1:N),S(1:N),color), grid on,axis([-floor(fs/2), floor(fs/2)-1,-150,20]);
xlabel(‘Frequency (Hz)’);
ylabel(‘Magnitude (dB)’);
title(ttStr);
end
(3)matlab DDS频谱图
可看出峰值最大的频率为10MHz,其他频率可通过滤波器消除。
四 DDS Modelsim仿真实验
4.1 实验内容
将第三章中的DDS电路再次用Modelsim仿真验证
将Modelsim的仿真数据导出到文件,用matlab分析信号频谱
4.2 Verilog程序
模块文件top_sin_wave.v、dds_core.v和sine_rom_10bit.v与三所用相同,仿真文件为testbench.v
testbench.v
包括保存数据的代码,其中将数据标记为signed时,输出数据默认为有符号格式
`timescale 1ns/1ns
module testbench();
wire W_clk,W_rst;
wire signed [9:0] W_sin_out;
initial begin
#10240 $stop();
end
gen_clk_rst U_gen_clk_rst(
.O_CLK(W_clk),
.O_RST(W_rst)
);
top_sin_wave U_top_sin_wave(
.CLK ( W_clk ) , // clock, posedge valid
.BUTRST ( W_rst ) , // reset button
//.CLKOUT ( ) , // clock output
.SINOUT ( W_sin_out ) ); // DDS sine wave out, to DAC
integer w_file;
    initial w_file = $fopen("data_out_1.txt");
    always @(W_sin_out)
        $fdisplay(w_file, "%h", W_sin_out);
endmodule
/
module gen_clk_rst(
O_CLK,
O_RST
);
parameter CLK_PERIOD_HALF = 1;
output reg O_CLK;
output reg O_RST;
initial begin
O_CLK = 0;
O_RST = 0;
# 100 O_RST = 1’b0;
# 200 O_RST = 1’b1;
end
always begin
#CLK_PERIOD_HALF O_CLK = ~O_CLK;
end
endmodule
4.3 modelsim仿真流程
(1)Modelsim脚本文件
build.do建立工作区
vlib work
vmap work
vlog +incdir+../src ../src/testbench.v
vlog +incdir+../src ../src/top_sin_wave.v
vlog +incdir+../src ../src/dds_core.v
vlog +incdir_../src ../src/sine_rom_10bit.v
sim_run.do
vsim -novopt -c -lib work testbench -suppress 3009
(2)仿真流程
1. 打开Modelsim,更改文件路径到Modelsim仿真文件所在文件夹
2. 运行do build.do
3. 运行do sim_rum.do
4. 选择观察信号W_sin_out
5. 运行run –all
6. 运行quit –sim结束仿真
(3)仿真结果
图4. 1 modelsim仿真10MHz正弦波
4.4使用matlab分析
将modelsim数据保存为modelsim_data.m文件
分析频谱主程序check_modelsim_data.m
modelsim_data;
signal_len = length(signal_out);
cfftwinplot(signal_out,50E6,’DDS MODELSIM OUTPUT SPECTRUM’, ‘red’);
cfftwinplot.m为绘图文件,与第三章相同
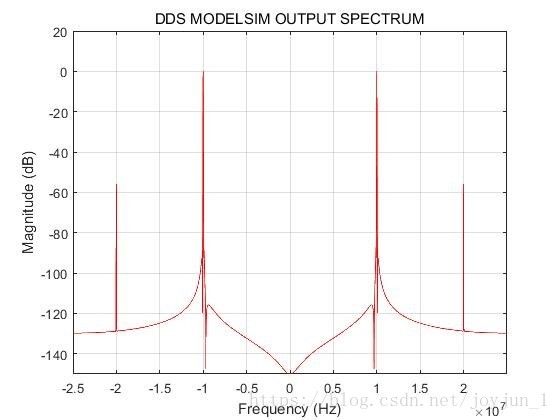
频谱图
图4. 2 matlab分析modelsim正弦波频谱
从图可以看出,DDS频率为10MHz,其他频率可用滤波器滤除。
##3.4 DDS RTL结构

图3. 1 10MHz正弦波DDS RTL

图3. 2 DDS核心RTL结构
##3.5 signaltap抓取图像

图3. 3 signaltap抓取DDS时序图像
##3.6 matlab分析
signaltap数据文件为signaltap_data.m,因数据过大,此处略去
###(1)matlab主程序check_board_data.m
```
signaltap_data;
signal_len = length(signal_out);
cfftwinplot(signal_out,50E6,'DDS OUTPUT SPECTRUM', 'red');(2)matlab绘频谱图函数
% ********************************************************************************
% file      : cfftwinplot.m
% usuage    : complex signal spectrum plot
% author    : [email protected]
% date      : 2007 Mar 5th
% version   : 0.1
% revise history
%   0.1 initial version
% ********************************************************************************

function cfftwinplot(data,fs,ttStr,color)
% function cfftwinplot(data,fs,ttStr,color)
% complex signal spectrum viewer
% data  : input data sequence
% fs    : sample rate
% ttStr : plot title string
% color : Plot colors

dataLen     = length(data);
lenLog2     = floor(log2(dataLen)) ;
procLen     = 2 ^ lenLog2;
fftLen      = procLen;
fftLenMax   = 128*1024;
if(fftLen > fftLenMax)
  fftLen = fftLenMax;
end
winLen      = fftLen;

noverlap    = 0;
order       = 10;
win         = kaiser(winLen, order);

data = data(1:procLen);

[S,W] = pwelch (data, win, noverlap, fftLen);

lenS= length(S);
S   = S./max(S);
S   = 10*log10(S+1e-15);

% when data is a real signal, S ~ [0, pi]
% copy a symmetric spectrum
if(lenS == ceil((fftLen+1)/2) )
 S(lenS) = [];
 SRot = S;
 SRot = rot90(SRot);
 SRot = rot90(SRot);
 S = [SRot;S];
else
% data is complex signal, S ~[0~2pi]
 S   = fftshift(S);
end

N = fftLen;
xvals = linspace(-floor(fs/2), floor(fs/2)-floor((fs/N)), N);
figure;
plot(xvals(1:N),S(1:N),color), grid on,axis([-floor(fs/2), floor(fs/2)-1,-150,20]);

xlabel('Frequency (Hz)');
ylabel('Magnitude (dB)');
title(ttStr);
end
(3)matlab DDS频谱图

图3. 4 matlab对signaltap抓取数据的频谱分析
可看出峰值最大的频率为10MHz,其他频率可通过滤波器消除。
四 DDS Modelsim仿真实验
4.1 实验内容
- 将第三章中的DDS电路再次用Modelsim仿真验证
- 将Modelsim的仿真数据导出到文件,用matlab分析信号频谱
4.2 Verilog程序
模块文件top_sin_wave.v、dds_core.v和sine_rom_10bit.v与三所用相同,仿真文件为testbench.v
testbench.v
包括保存数据的代码,其中将数据标记为signed时,输出数据默认为有符号格式
`timescale 1ns/1ns
module testbench();
    wire W_clk,W_rst;
    wire signed [9:0] W_sin_out;
    initial begin
    #10240 $stop();
    end
    gen_clk_rst U_gen_clk_rst(
        .O_CLK(W_clk),
        .O_RST(W_rst)
    );
    top_sin_wave U_top_sin_wave(
    .CLK     (  W_clk   )  ,   // clock, posedge valid
    .BUTRST  (  W_rst   )  ,   // reset button
    //.CLKOUT  (        )  ,   // clock output
    .SINOUT  (  W_sin_out   )  );  // DDS sine wave out, to DAC

    integer w_file;
        initial w_file = $fopen("data_out_1.txt");
        always @(W_sin_out)
            $fdisplay(w_file, "%h", W_sin_out);
endmodule
/////////////////////////////////////
module gen_clk_rst(
    O_CLK,
    O_RST
);
parameter CLK_PERIOD_HALF = 1;

output reg O_CLK;
output reg O_RST;

initial begin
    O_CLK   = 0;
    O_RST   = 0;
    # 100 O_RST = 1'b0;
    # 200 O_RST = 1'b1;
end

always begin
    #CLK_PERIOD_HALF O_CLK = ~O_CLK;
end
endmodule
4.3 modelsim仿真流程
(1)Modelsim脚本文件
build.do建立工作区
vlib work
vmap work
vlog +incdir+../src ../src/testbench.v
vlog +incdir+../src ../src/top_sin_wave.v
vlog +incdir+../src ../src/dds_core.v
vlog +incdir_../src ../src/sine_rom_10bit.v
sim_run.do
vsim -novopt -c -lib work testbench -suppress 3009(2)仿真流程
- 打开Modelsim,更改文件路径到Modelsim仿真文件所在文件夹
- 运行do build.do
- 运行do sim_rum.do
- 选择观察信号W_sin_out
- 运行run –all
- 运行quit –sim结束仿真
(3)仿真结果
4.4使用matlab分析
(1)将modelsim数据保存为modelsim_data.m文件
(2)分析频谱主程序check_modelsim_data.m
modelsim_data;
signal_len = length(signal_out);
cfftwinplot(signal_out,50E6,'DDS MODELSIM OUTPUT SPECTRUM', 'red');
(3)cfftwinplot.m为绘图文件,与第三章相同

图4. 2 matlab分析modelsim正弦波频谱
从图可以看出,DDS频率为10MHz,其他频率可用滤波器滤除。

