【python画图】——数据注释ax.test()/plot.test()
ax.test()
plot.test()
作用一直,主要是区分一下作用区域
话不多说举例说名一下
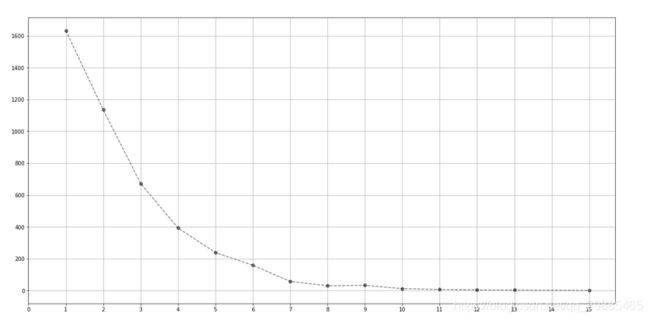
画了一个图干干巴巴麻麻勒勒的不方便查看
#调用包略
#代码不用看太细举例说明而已
fig,ax=plt.subplots(1,1,figsize=(20, 10))
ax.grid()
x=total.index
y=total['var1']
ax.plot(x,y,'k--o',alpha=0.5)
ax.set_xticks(range(0,16))
#法一:
 for a, b in zip(x, y):    #不了解zip()函数去百度一下,就是对应关系,a对应x;b对应y
     plt.text(a, b, b, ha='center', va='bottom', fontsize=20)
#法二:
for a, b in data:
     #plt.text(a, b, b, ha='center', va='bottom', fontsize=20)
plt.text(x, y, s, fontdict=None, withdash=False, **kwargs)
x:x轴对应的数据
y:y轴对应的数据
s:要备注的数据
Help on function text in module matplotlib.pyplot:

text(x, y, s, fontdict=None, withdash=False, **kwargs)
    Add text to the axes.

    Add the text *s* to the axes at location *x*, *y* in data coordinates.

    Parameters
    ----------
    x, y : scalars
        The position to place the text. By default, this is in data
        coordinates. The coordinate system can be changed using the
        *transform* parameter.

    s : str
        The text.

    fontdict : dictionary, optional, default: None
        A dictionary to override the default text properties. If fontdict
        is None, the defaults are determined by your rc parameters.

    withdash : boolean, optional, default: False
        Creates a `~matplotlib.text.TextWithDash` instance instead of a
        `~matplotlib.text.Text` instance.

    Returns
    -------
    text : `.Text`
        The created `.Text` instance.

    Other Parameters
    ----------------
    **kwargs : `~matplotlib.text.Text` properties.
        Other miscellaneous text parameters.

    Examples
    --------
    Individual keyword arguments can be used to override any given
    parameter::

        >>> text(x, y, s, fontsize=12)

    The default transform specifies that text is in data coords,
    alternatively, you can specify text in axis coords (0,0 is
    lower-left and 1,1 is upper-right).  The example below places
    text in the center of the axes::

        >>> text(0.5, 0.5, 'matplotlib', horizontalalignment='center',
        ...      verticalalignment='center', transform=ax.transAxes)

    You can put a rectangular box around the text instance (e.g., to
    set a background color) by using the keyword `bbox`.  `bbox` is
    a dictionary of `~matplotlib.patches.Rectangle`
    properties.  For example::

        >>> text(x, y, s, bbox=dict(facecolor='red', alpha=0.5))
喜欢可以关注【小猪课堂】公众号了解更多内容
