如何用Python进行历史股价分析
如何用Python进行历史股价分析
- 一、 概述
- 二、 概念
- 三、 操作
-
- 3.1 统计分析
- 3.2 股票收益率
- 3.3 日期分析
- 3.4 周汇总
- 3.5 真实波动幅度均值
- 3.6 简单移动平均线
- 3.7 指数移动平均线
- 3.8 布林带
- 3.9 线性模型
- 3.10 趋势线
一、 概述
通过历史股价信息:日期、开市价(最高、最低)和收市价(最高、最低)、成交量,计算一些股价的统计指标,如收益率,有关价格的统计值,根据历史股价进行周分析,日期分析,图表分析:移动平均线、布林带,趋势线。
如果你感兴趣,就跟着例子做一遍熟悉一下吧。
二、 概念
- 加权平均价格:加权平均价是指用数量作为权数进行平均计算的价格。加权平均是统计学的一个概念,一组数据中某一个数的频数称为权重,简单说就是,数值乘以频数再除以总数据个数就是加权平均了。
比方说,黄金报价:有最高价和最低价2种,其中最高价261.79,占57.3%;最低价255,占42.7%。那黄金的加权平均价为:261.7957.3%+25542.7%=258.89 - 极差:极差又称范围误差或全距(Range),以R表示,是用来表示统计资料中的变异量数(measures of variation),其最大值与最小值之间的差距,即最大值减最小值后所得数据。
最直接也是最简单的方法,即最大值-最小值(也就是极差)来评价一组数据的离散度。这一方法在日常生活中最为常见,比如比赛中去掉最高最低分就是极差的具体应用。极差=最大标志值—最小标志值。例如 :12 12 13 14 16 21,这组数的极差就是 :21-12=9 - 股票收益率:股票收益率是反映股票收益水平的指标。投资者购买股票或债券最关心的是能获得多少收益,衡量一项证券投资收益大小以收益率来表示。
股票收益率(stock yield),是指投资于股票所获得的收益总额与原始投资额的比率。股票得到了投资者的青睐,因为购买股票所带来的收益。股票绝对收益率是股息,相对收益是股票收益率。
股票收益率=收益额/原始投资额
当股票未出卖时,收益额即为股利。
衡量股票投资收益水平指标主要有股利收益率、持有期收益率与拆股后持有期收益率等。 - 日期分析:分析收市价最高价,获得一个月中每个周日期(周一到周五)数据的平均值,输出最大和最小平均值,并输出周日期。
- 周汇总:将一个月的数组进行分周统计,输出周统计数据情况。
- 真实波动幅度均值:真实波动幅度均值(ATR)是由韦尔斯·王尔德所发展出来的技术分析指标,以 N 天的指数移动平均数平均後的交易波动幅度。
一天的交易幅度只是单纯地 最大值 - 最小值。而真实波动幅度则包含昨天的收盘价,若其在今天的幅度之外:
真实波动幅度 = max(最大值,昨日收盘价) − min(最小值,昨日收盘价) 真实波动幅度均值便是「真实波动幅度」的 N 日 指数移动平均数。
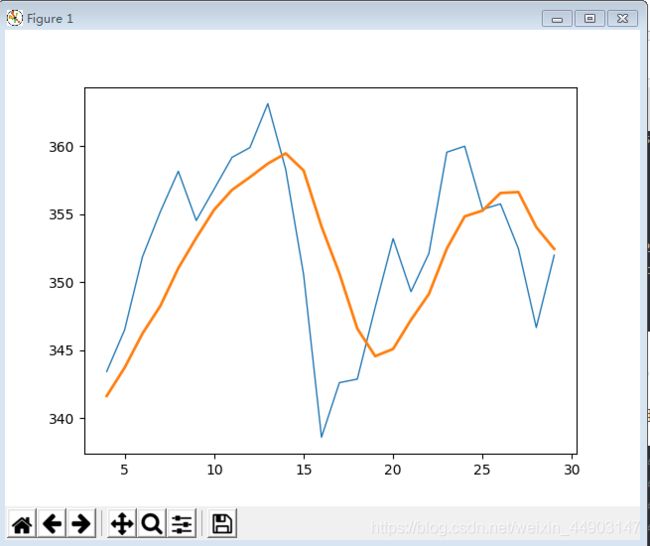
波动幅度的概念表示可以显示出交易者的期望和热情。大幅的或增加中的波动幅度表示交易者在当天可能准备持续买进或卖出股票。波动幅度的减少则表示交易者对股市没有太大的兴趣。 - 简单移动平均线:简单移动均线是移动均线家族中最简单的一类。
简单移动均线是指特定期间的收盘价进行简单平均化的意思。我们一般所提及的移动均线即指简单移动均线。
举个简单的例子。如果你打算在1小时图上描绘出过去5段时间的简单移动平均线,你需要将过去5小时的收盘价相加后再除以5。这样,你就计算出过去5小时的收盘平均价。将这些平均价格连成线,你就得到一条移动平均线。
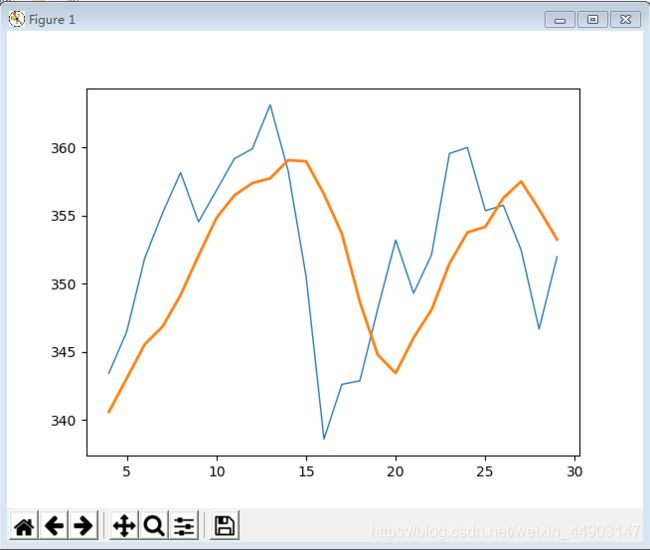
如果你打算在30分钟图上描绘出过去5段时间的简单移动平均线,那么你需要将过去150分钟的收盘价相加再除以5,以此类推。 - 指数移动平均线:EXPMA(Exponential Moving Average)译指数平滑移动平均线,乃为因应移动平均线被视为落后指标的缺失而发展出来的,为解决一旦价格已脱离均线差值扩大,而平均线未能立即反应,EXPMA可以减少类似缺点。
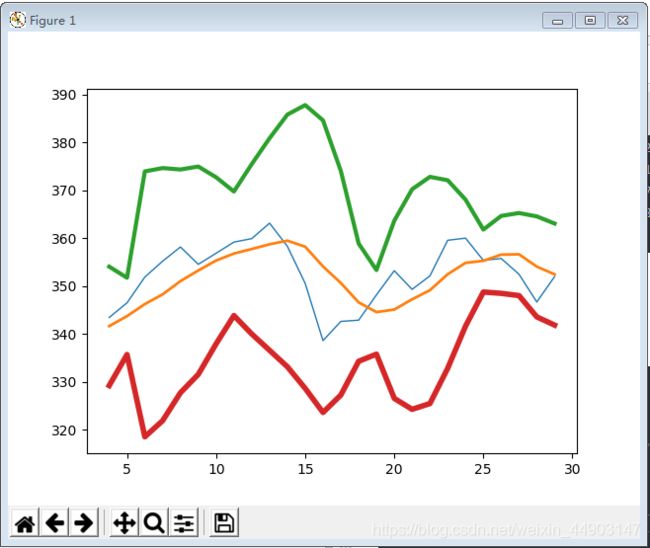
求X的N日指数平滑移动平均,在股票公式中一般表达为:EMA(X,N),其中X为当日收盘价,N为天数。它真正的公式表达是:当日指数平均值=平滑系数*(当日指数值-昨日指数平均值)+昨日指数平均值;平滑系数=2/(周期单位+1);由以上公式推导开,得到:EMA(N)=2*X/(N+1)+(N-1)*EMA(N-1)/(N+1)。 - 布林带:布林线(Bollinger Band) 是根据统计学中的标准差原理设计出来的一种非常实用的技术指标。它由三条轨道线组成,其中上下两条线分别可以看成是价格的压力线和支撑线,在两条线之间是一条价格平均线,一般情况价格线在由上下轨道组成的带状区间游走,而且随价格的变化而自动调整轨道的位置。当波带变窄时,激烈的价格波动有可能随即产生;若高低点穿越带边线时,立刻又回到波带内,则会有回档产生。
保利加通道也称为布林线(Bollinger Band)是由三条线组成,在中间的通常为 20 天平均线,而在上下的两条线则分别为Up 线和 Down 线,算法是首先计出过去 20 日收巿价的标准差 SD(Standard Deviation) ,通常再乘 2 得出 2 倍标准差, Up 线为 20 天平均线加 2 倍标准差, Down 线则为 20 天平均线减 2 倍标准差。
中间线 = 20 日均线
Up 线 = 20 日均线 + 2SD(20 日收巿价)
Down 线 =20 日均线 - 2SD(20 日收巿价) - 线性模型:线性模型是一类统计模型的总称,制作方法是用一定的流程将各个环节连接起来,包括线性回归模型、方差分析模型。
一般线性模型或多元回归模型是一个统计线性模型。公式为:Y=XB+U
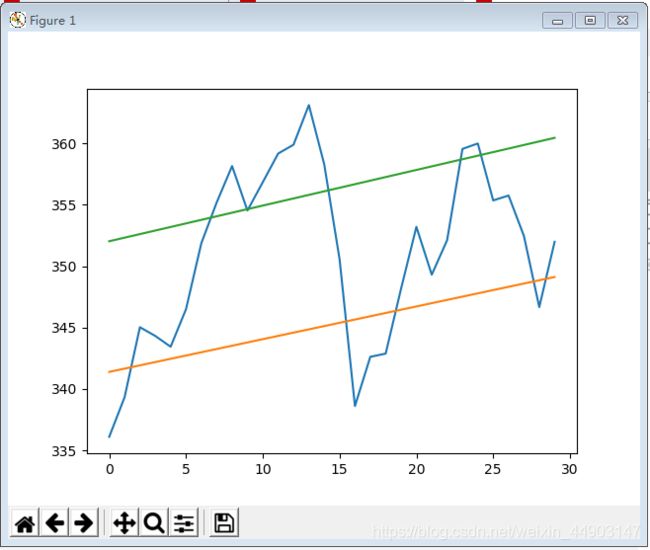
其中Y是具有一系列多变量测量的矩阵(每列是一个因变量的测量集合),X是独立变量的观察矩阵,其可以是设计矩阵(每列是关于一个自变量),B是包含通常要被估计的参数的矩阵,并且U是包含误差(噪声)的矩阵。错误通常被认为是不相关的测量,并遵循多元正态分布。如果错误不遵循多元正态分布,广义线性模型可以用来放松关于Y和U的假设。 - 趋势线:趋势线是技术分析家们用来绘制的某一证券 (股票) 或商品期货过去价格走势的线。目的是用来预测未来的价格变化。这条直线是通过联结某一特定时期内证券或商品期货上升或下跌的最高或最低价格点而成。最终直线的角度将指明该证券或商品期货是处于上升的趋势还是处于下跌的趋势。如果价格上升到了向下倾斜的趋势线之上,或下降到了向上倾斜的趋势线之下,技术分析家们一般认为,一个新的价格走向可能出现。
趋势线的最基本形式是,在一个上升的趋势中,连接明显的支撑区域(最低点)的直线就是趋势线。在一个下降趋势中,连接明显阻力区域(最高点)的直线,也是趋势线。
趋势的3种类型:
上升趋势(更高的低点)
下降趋势(更低的高点)
横向趋势 (区域震荡)
三、 操作
历史股价信息样例文件下载:https://pan.baidu.com/s/1ZtBOgbOqD2K3dM5hIsLuKA
3.1 统计分析
下载历史股价信息样例文件,放置在固定位置,更改导入文件路径,运行代码
用例:
import numpy as np

# 读入文件
str = "样例文件路径"

c, v = np.loadtxt(str, delimiter=',', usecols=(6, 7), unpack=True)
print("\n\r读入文件\n\r第7列数据收市价最高价\n\r价格c =", c)
print("\n\r第8列数据成交量\n\r成交量v =", v)

# 计算成交量加权平均价格
vwap = np.average(c, weights=v)
print("\n\r1 计算成交量加权平均价格\n\r计算成交量加权平均价格\n\rnp.average(c, weights=v)=", vwap)

# 算术平均值函数
print("\n\r2 算术平均值函数\n\r2 开市价最高值算术平均值\n\r平均价格mean=", np.mean(c))

# 时间加权平均价格
t = np.arange(len(c))
print("\n\r3 时间加权平均价格\n\r时间\n\r时间数组t =", t)
print("\n\r时间加权平均价格\n\rnp.average(c, weights=t)=", np.average(c, weights=t))

# 寻找最大值和最小值
h, l = np.loadtxt(str, delimiter=',', usecols=(4, 5), unpack=True)
print("\n\r4 寻找最大值和最小值\n\r第5列数据开市价最高价\n\r价格h=", h)
print("\n\r第6列数据收市价最低价\n\r价格l=", l)
print("\n\r开市价最大值\n\rhighest=", np.max(h))
print("\n\r收市价最小值\n\rlowest=", np.min(l))
print("\n\r开市价最大与收市价最小的中间值\n\rmedile=", (np.max(h) + np.min(l)) / 2)
print("\n\r开市价最高价的极差(波动)\n\rSpread high price=", np.ptp(h))
print("\n\r收市价最低价的极差(波动)\n\rSpread low price=", np.ptp(l))

# 统计分析
c = np.loadtxt(str, delimiter=',', usecols=(6,), unpack=True)
print("\n\r---------------------------------------------------------------")
print("\n\r统计分析\n\r第7列数据收市价最高价\n\r价格c =", c)
print("\n\r1 收市价最高价的中位数\n\rmedian(c)=", np.median(c))

sorted = np.msort(c)
print("\n\r2 c排序\n\rsorted =", sorted)

print("\n\r3 收市价最高价的方差(函数)\n\rvariance=", np.var(c))
print("\n\r4 收市价最高价的方差(公式)\n\rvariance from definition=", np.mean((c - c.mean()) ** 2))
结果
读入文件
第7列数据收市价最高价
价格c = [336.1  339.32 345.03 344.32 343.44 346.5  351.88 355.2  358.16 354.54
 356.85 359.18 359.9  363.13 358.3  350.56 338.61 342.62 342.88 348.16
 353.21 349.31 352.12 359.56 360.   355.36 355.76 352.47 346.67 351.99]

第8列数据成交量
成交量v = [21144800. 13473000. 15236800.  9242600. 14064100. 11494200. 17322100.
 13608500. 17240800. 33162400. 13127500. 11086200. 10149000. 17184100.
 18949000. 29144500. 31162200. 23994700. 17853500. 13572000. 14395400.
 16290300. 21521000. 17885200. 16188000. 19504300. 12718000. 16192700.
 18138800. 16824200.]

1 计算成交量加权平均价格
计算成交量加权平均价格
np.average(c, weights=v)= 350.5895493532009

2 算术平均值函数
2 开市价最高值算术平均值
平均价格mean= 351.0376666666667

3 时间加权平均价格
时间
时间数组t = [ 0  1  2  3  4  5  6  7  8  9 10 11 12 13 14 15 16 17 18 19 20 21 22 23
 24 25 26 27 28 29]

时间加权平均价格
np.average(c, weights=t)= 352.4283218390804

4 寻找最大值和最小值
第5列数据开市价最高价
价格h= [344.4  340.04 345.65 345.25 344.24 346.7  353.25 355.52 359.   360.
 357.8  359.48 359.97 364.9  360.27 359.5  345.4  344.64 345.15 348.43
 355.05 355.72 354.35 359.79 360.29 361.67 357.4  354.76 349.77 352.32]

第6列数据收市价最低价
价格l= [333.53 334.3  340.98 343.55 338.55 343.51 347.64 352.15 354.87 348.
 353.54 356.71 357.55 360.5  356.52 349.52 337.72 338.61 338.37 344.8
 351.12 347.68 348.4  355.92 357.75 351.31 352.25 350.6  344.9  345.  ]

开市价最大值
highest= 364.9

收市价最小值
lowest= 333.53

开市价最大与收市价最小的中间值
medile= 349.215

开市价最高价的极差(波动)
Spread high price= 24.859999999999957

收市价最低价的极差(波动)
Spread low price= 26.970000000000027

---------------------------------------------------------------

统计分析
第7列数据收市价最高价
价格c = [336.1  339.32 345.03 344.32 343.44 346.5  351.88 355.2  358.16 354.54
 356.85 359.18 359.9  363.13 358.3  350.56 338.61 342.62 342.88 348.16
 353.21 349.31 352.12 359.56 360.   355.36 355.76 352.47 346.67 351.99]

1 收市价最高价的中位数
median(c)= 352.055

2 c排序
sorted = [336.1  338.61 339.32 342.62 342.88 343.44 344.32 345.03 346.5  346.67
 348.16 349.31 350.56 351.88 351.99 352.12 352.47 353.21 354.54 355.2
 355.36 355.76 356.85 358.16 358.3  359.18 359.56 359.9  360.   363.13]

3 收市价最高价的方差(函数)
variance= 50.126517888888884

4 收市价最高价的方差(公式)
variance from definition= 50.126517888888884
3.2 股票收益率
用例:
# 股票收益率
import numpy as np

# 读入文件
str = "样例文件路径"

c = np.loadtxt(str, delimiter=',', usecols=(6,), unpack=True)
returns = np.diff(c) / c[: -1]
print("\n\r---------------------------------------------------------------")
print("\n\r股票收益率\n\r第7列数据收市价最高价\n\r价格c=", c)
print("\n\r1 收市价最高价数组差分\n\rnp.diff(c)=", np.diff(c))
print("\n\r2 去掉最后一个元素\n\rc[: -1]=", c[: -1])
print("\n\r3 收益率\n\rreturns=", returns)
print("\n\r4 收益率的标准差\n\rStandard deviation=", np.std(returns))

posretindices = np.where(returns > 0)
print("\n\r5 打印收益率大于0的序号\n\rposretindices=", posretindices)

logreturns = np.diff(np.log(c))
print("\n\r6 收市价最高价的自然对数\n\rnp.log(c)=", np.log(c))
print("\n\r7 对数收益率\n\rlogreturns=", logreturns)

annual_volatility = np.std(logreturns) / np.mean(logreturns)
annual_volatility = annual_volatility / np.sqrt(1. / 252.)
print("\n\r8 收市价最高价的年度波动\n\rAnnual volatility=", annual_volatility)
print("\n\r9 收市价最高价的月度波动\n\rMonthly volatility=", annual_volatility * np.sqrt(1. / 12.))
结果
股票收益率
第7列数据收市价最高价
价格c= [336.1  339.32 345.03 344.32 343.44 346.5  351.88 355.2  358.16 354.54
 356.85 359.18 359.9  363.13 358.3  350.56 338.61 342.62 342.88 348.16
 353.21 349.31 352.12 359.56 360.   355.36 355.76 352.47 346.67 351.99]

1 收市价最高价数组差分
np.diff(c)= [  3.22   5.71  -0.71  -0.88   3.06   5.38   3.32   2.96  -3.62   2.31
   2.33   0.72   3.23  -4.83  -7.74 -11.95   4.01   0.26   5.28   5.05
  -3.9    2.81   7.44   0.44  -4.64   0.4   -3.29  -5.8    5.32]

2 去掉最后一个元素
c[: -1]= [336.1  339.32 345.03 344.32 343.44 346.5  351.88 355.2  358.16 354.54
 356.85 359.18 359.9  363.13 358.3  350.56 338.61 342.62 342.88 348.16
 353.21 349.31 352.12 359.56 360.   355.36 355.76 352.47 346.67]

3 收益率
returns= [ 0.00958048  0.01682777 -0.00205779 -0.00255576  0.00890985  0.0155267
  0.00943503  0.00833333 -0.01010721  0.00651548  0.00652935  0.00200457
  0.00897472 -0.01330102 -0.02160201 -0.03408832  0.01184253  0.00075886
  0.01539897  0.01450483 -0.01104159  0.00804443  0.02112916  0.00122372
 -0.01288889  0.00112562 -0.00924781 -0.0164553   0.01534601]

4 收益率的标准差
Standard deviation= 0.012922134436826306

5 打印收益率大于0的序号
posretindices= (array([ 0,  1,  4,  5,  6,  7,  9, 10, 11, 12, 16, 17, 18, 19, 21, 22, 23,
       25, 28], dtype=int64),)

6 收市价最高价的自然对数
np.log(c)= [5.81740873 5.82694361 5.84363137 5.84157146 5.83901242 5.84788282
 5.86329021 5.87268101 5.88097981 5.87082117 5.87731553 5.88382366
 5.88582622 5.8947609  5.88137062 5.85953188 5.824849   5.83662196
 5.83738053 5.85266214 5.86706278 5.85595978 5.86397203 5.88488106
 5.88610403 5.87313136 5.87425635 5.86496551 5.84837332 5.86360277]

7 对数收益率
logreturns= [ 0.00953488  0.01668775 -0.00205991 -0.00255903  0.00887039  0.01540739
  0.0093908   0.0082988  -0.01015864  0.00649435  0.00650813  0.00200256
  0.00893468 -0.01339027 -0.02183875 -0.03468287  0.01177296  0.00075857
  0.01528161  0.01440064 -0.011103    0.00801225  0.02090904  0.00122297
 -0.01297267  0.00112499 -0.00929083 -0.01659219  0.01522945]

8 收市价最高价的年度波动
Annual volatility= 129.27478991115132

9 收市价最高价的月度波动
Monthly volatility= 37.318417377317765
3.3 日期分析
用例:
import numpy as np

# 读入文件
str = "样例文件路径"

# 日期分析
from datetime import datetime

# Monday 0
# Tuesday 1
# Wednesday 2
# Thursday 3
# Friday 4
# Saturday 5
# Sunday 6

def datestr2num(s):
    return datetime.strptime(s.decode('ascii'), "%d-%m-%Y").date().weekday()

dates, close = np.loadtxt(str, delimiter=',', usecols=(1, 6), converters={
     1: datestr2num}, unpack=True)
print("\n\r---------------------------------------------------------------")
print("\n\r日期分析\n\r第2列数据日期\n\r日期数组dates=", dates)
print("\n\r第7列数据收市价最高价\n\rclose=", close)

averages = np.zeros(5)

print("\n\r")
for i in range(5):
    indices = np.where(dates == i)
    prices = np.take(close, indices)
    avg = np.mean(prices)
    print("Day", i, "prices", prices, "Average", avg)
    averages[i] = avg

top = np.max(averages)
print("\n\r1 最大值平均值\n\rHighest average=", top)
print("\n\r2 最大值平均值的日期(索引)\n\rTop day of the week=", np.argmax(averages))

bottom = np.min(averages)
print("\n\r3 最小值平均值\n\rLowest average", bottom)
print("\n\r4 最小值平均值的日期(索引)\n\rBottom day of the week=", np.argmin(averages))
结果
日期分析
第2列数据日期
日期数组dates= [4. 0. 1. 2. 3. 4. 0. 1. 2. 3. 4. 0. 1. 2. 3. 4. 1. 2. 3. 4. 0. 1. 2. 3.
 4. 0. 1. 2. 3. 4.]

第7列数据收市价最高价
close= [336.1  339.32 345.03 344.32 343.44 346.5  351.88 355.2  358.16 354.54
 356.85 359.18 359.9  363.13 358.3  350.56 338.61 342.62 342.88 348.16
 353.21 349.31 352.12 359.56 360.   355.36 355.76 352.47 346.67 351.99]

Day 0 prices [[339.32 351.88 359.18 353.21 355.36]] Average 351.7900000000001
Day 1 prices [[345.03 355.2  359.9  338.61 349.31 355.76]] Average 350.63500000000005
Day 2 prices [[344.32 358.16 363.13 342.62 352.12 352.47]] Average 352.1366666666666
Day 3 prices [[343.44 354.54 358.3  342.88 359.56 346.67]] Average 350.8983333333333
Day 4 prices [[336.1  346.5  356.85 350.56 348.16 360.   351.99]] Average 350.0228571428571

1 最大值平均值
Highest average= 352.1366666666666

2 最大值平均值的日期(索引)
Top day of the week= 2

3 最小值平均值
Lowest average 350.0228571428571

4 最小值平均值的日期(索引)
Bottom day of the week= 4
3.4 周汇总
用例:
import numpy as np
from datetime import datetime

# 读入文件
str = "样例文件路径"
# 保存文件
destr = "文件保存路径"

# 周汇总
def datestr2num(s):
    return datetime.strptime(s.decode('ascii'), "%d-%m-%Y").date().weekday()

dates, open, high, low, close = np.loadtxt(str, delimiter=',', usecols=(1, 3, 4, 5, 6), converters={
     1: datestr2num}, unpack=True)
close = close[:16]
dates = dates[:16]

print("\n\r---------------------------------------------------------------")
print("\n\r周汇总\n\r第2列数据日期\n\r日期数组dates=", dates)
print("\n\r第4列数据开市价最低价\n\r价格open =", open)
print("\n\r第5列数据开市价最高价\n\r价格high=", high)
print("\n\r第6列数据收市价最低价\n\r价格low=", low)
print("\n\r第7列数据收市价最高价\n\r价格close =", close)

# get first Monday
first_monday = np.ravel(np.where(dates == 0))[0]
print("\n\r1 第一个周一日期\n\rThe first Monday index is", first_monday)

# get last Friday
last_friday = np.ravel(np.where(dates == 4))[-1]
print("\n\r2 最后一个周五日期\n\rThe last Friday index is", last_friday)

weeks_indices = np.arange(first_monday, last_friday + 1)
print("\n\r3 日期数组\n\rWeeks indices initial", weeks_indices)

weeks_indices = np.split(weeks_indices, 3)
print("\n\r4 周日期数组\n\rWeeks indices after split", weeks_indices)

def summarize(a, o, h, l, c):
    monday_open = o[a[0]]
    week_high = np.max(np.take(h, a))
    week_low = np.min(np.take(l, a))
    friday_close = c[a[-1]]
    return ("APPL", monday_open, week_high, week_low, friday_close)

weeksummary = np.apply_along_axis(summarize, 1, weeks_indices, open, high, low, close)
print("\n\r5 周汇总\n\rWeek summary=\n\r", weeksummary)

np.savetxt(destr, weeksummary, delimiter=",", fmt="%s")
结果
周汇总
第2列数据日期
日期数组dates= [4. 0. 1. 2. 3. 4. 0. 1. 2. 3. 4. 0. 1. 2. 3. 4.]

第4列数据开市价最低价
价格open = [344.17 335.8  341.3  344.45 343.8  343.61 347.89 353.68 355.19 357.39
 354.75 356.79 359.19 360.8  357.1  358.21 342.05 338.77 344.02 345.29
 351.21 355.47 349.96 357.2  360.07 361.11 354.91 354.69 349.69 345.4 ]

第5列数据开市价最高价
价格high= [344.4  340.04 345.65 345.25 344.24 346.7  353.25 355.52 359.   360.
 357.8  359.48 359.97 364.9  360.27 359.5  345.4  344.64 345.15 348.43
 355.05 355.72 354.35 359.79 360.29 361.67 357.4  354.76 349.77 352.32]

第6列数据收市价最低价
价格low= [333.53 334.3  340.98 343.55 338.55 343.51 347.64 352.15 354.87 348.
 353.54 356.71 357.55 360.5  356.52 349.52 337.72 338.61 338.37 344.8
 351.12 347.68 348.4  355.92 357.75 351.31 352.25 350.6  344.9  345.  ]

第7列数据收市价最高价
价格close = [336.1  339.32 345.03 344.32 343.44 346.5  351.88 355.2  358.16 354.54
 356.85 359.18 359.9  363.13 358.3  350.56]

1 第一个周一日期
The first Monday index is 1

2 最后一个周五日期
The last Friday index is 15

3 日期数组
Weeks indices initial [ 1  2  3  4  5  6  7  8  9 10 11 12 13 14 15]

4 周日期数组
Weeks indices after split [array([1, 2, 3, 4, 5], dtype=int64), array([ 6,  7,  8,  9, 10], dtype=int64), array([11, 12, 13, 14, 15], dtype=int64)]

5 周汇总
Week summary=
 [['APPL' '335.8' '346.7' '334.3' '346.5']
 ['APPL' '347.8' '360.0' '347.6' '356.8']
 ['APPL' '356.7' '364.9' '349.5' '350.5']]
3.5 真实波动幅度均值
用例:
import numpy as np

# 读入文件
str = "样例文件路径"

# 真实波动幅度均值
h, l, c = np.loadtxt(str, delimiter=',', usecols=(4, 5, 6), unpack=True)
N = 20
h = h[-N:]
l = l[-N:]

print("\n\r---------------------------------------------------------------")
print("\n\r真实波动幅度均值\n\r1 第5列数据后20天开市价最高价\n\rh=\n\r", h)
print("\n\r2 第6列数据后20天收市价最低价\n\rl=\n\r", l)
print("\n\rlen(h)=", len(h), "\n\rlen(l)=", len(l))
print("\n\r3 第7列数据收市价最高价\n\rclose=\n\r", c)

previousclose = c[-N - 1: -1]
print("\n\rlen(previousclose)=", len(previousclose))
print("\n\r4 第7列数据后20天收市价最高价\n\rPrevious close=\n\r", previousclose)

truerange = np.maximum(h - l, h - previousclose, previousclose - l)
print("\n\r5 波动最大值\n\rTrue range=\n\r", truerange)

atr = np.zeros(N)
atr[0] = np.mean(truerange)

for i in range(1, N):
    atr[i] = (N - 1) * atr[i - 1] + truerange[i]
    atr[i] /= N

print("\n\r6 均幅指标\n\rATR=\n\r", atr)
结果
真实波动幅度均值
1 第5列数据后20天开市价最高价
h=
 [357.8  359.48 359.97 364.9  360.27 359.5  345.4  344.64 345.15 348.43
 355.05 355.72 354.35 359.79 360.29 361.67 357.4  354.76 349.77 352.32]

2 第6列数据后20天收市价最低价
l=
 [353.54 356.71 357.55 360.5  356.52 349.52 337.72 338.61 338.37 344.8
 351.12 347.68 348.4  355.92 357.75 351.31 352.25 350.6  344.9  345.  ]

len(h)= 20
len(l)= 20

3 第7列数据收市价最高价
close=
 [336.1  339.32 345.03 344.32 343.44 346.5  351.88 355.2  358.16 354.54
 356.85 359.18 359.9  363.13 358.3  350.56 338.61 342.62 342.88 348.16
 353.21 349.31 352.12 359.56 360.   355.36 355.76 352.47 346.67 351.99]

len(previousclose)= 20

4 第7列数据后20天收市价最高价
Previous close=
 [354.54 356.85 359.18 359.9  363.13 358.3  350.56 338.61 342.62 342.88
 348.16 353.21 349.31 352.12 359.56 360.   355.36 355.76 352.47 346.67]

5 波动最大值
True range=
 [ 4.26  2.77  2.42  5.    3.75  9.98  7.68  6.03  6.78  5.55  6.89  8.04
  5.95  7.67  2.54 10.36  5.15  4.16  4.87  7.32]

6 均幅指标
ATR=
 [5.8585     5.704075   5.53987125 5.51287769 5.4247338  5.65249711
 5.75387226 5.76767864 5.81829471 5.80487998 5.85913598 5.96817918
 5.96727022 6.05240671 5.87678637 6.10094705 6.0533997  5.95872972
 5.90429323 5.97507857]
3.6 简单移动平均线
用例:
import numpy as np
from matplotlib.pyplot import plot
from matplotlib.pyplot import show

# 读入文件
str = "样例文件路径"

# 简单移动平均线
N = 5
weights = np.ones(N) / N

print("\n\r---------------------------------------------------------------")
print("\n\r简单移动平均线\n\r区间0.2\n\rWeights=", weights)

c = np.loadtxt(str, delimiter=',', usecols=(6,), unpack=True)
sma = np.convolve(weights, c)[N - 1:-N + 1]
t = np.arange(N - 1, len(c))

print("\n\r第7列数据收市价最高价\n\rc=\n\r", c)
print("\n\r1 卷积\n\rsma=\n\r", sma)
print("\n\r2 日期区间\n\rt=\n\r", t)

plot(t, c[N - 1:], lw=1.0) # 收市价最高价时间曲线
plot(t, sma, lw=2.0)
show()
结果
简单移动平均线
区间0.2
Weights= [0.2 0.2 0.2 0.2 0.2]

第7列数据收市价最高价
c=
 [336.1  339.32 345.03 344.32 343.44 346.5  351.88 355.2  358.16 354.54
 356.85 359.18 359.9  363.13 358.3  350.56 338.61 342.62 342.88 348.16
 353.21 349.31 352.12 359.56 360.   355.36 355.76 352.47 346.67 351.99]

1 卷积
sma=
 [341.642 343.722 346.234 348.268 351.036 353.256 355.326 356.786 357.726
 358.72  359.472 358.214 354.1   350.644 346.594 344.566 345.096 347.236
 349.136 352.472 354.84  355.27  356.56  356.63  354.052 352.45 ]

2 日期区间
t=
 [ 4  5  6  7  8  9 10 11 12 13 14 15 16 17 18 19 20 21 22 23 24 25 26 27
 28 29]
3.7 指数移动平均线
用例:
import numpy as np
from matplotlib.pyplot import plot
from matplotlib.pyplot import show

# 读入文件
str = "样例文件路径"

# 指数移动平均线
x = np.arange(5)

print("\n\r---------------------------------------------------------------")
print("\n\r指数移动平均线\n\r1 自然对数\n\rExp=", np.exp(x))
print("\n\r2 创建均匀区间\n\rLinspace=", np.linspace(-1, 0, 5))

N = 5
weights = np.exp(np.linspace(-1., 0., N))
weights /= weights.sum()
print("\n\r3 区间\n\rWeights=", weights)

c = np.loadtxt(str, delimiter=',', usecols=(6,), unpack=True)
ema = np.convolve(weights, c)[N - 1:-N + 1]
t = np.arange(N - 1, len(c))

print("\n\r4 第7列数据收市价最高价\n\rc=\n\r", c)
print("\n\r5 卷积\n\rema=\n\r", ema)
print("\n\r6 日期区间\n\rt=\n\r", t)

plot(t, c[N - 1:], lw=1.0)
plot(t, ema, lw=2.0)
show()
结果
指数移动平均线
1 自然对数
Exp= [ 1.          2.71828183  7.3890561  20.08553692 54.59815003]

2 创建均匀区间
Linspace= [-1.   -0.75 -0.5  -0.25  0.  ]

3 区间
Weights= [0.11405072 0.14644403 0.18803785 0.24144538 0.31002201]

4 第7列数据收市价最高价
c=
 [336.1  339.32 345.03 344.32 343.44 346.5  351.88 355.2  358.16 354.54
 356.85 359.18 359.9  363.13 358.3  350.56 338.61 342.62 342.88 348.16
 353.21 349.31 352.12 359.56 360.   355.36 355.76 352.47 346.67 351.99]

5 卷积
ema=
 [340.5975344  343.06107601 345.55611377 346.86543931 349.16687079
 352.05941068 354.81884961 356.48612788 357.38745929 357.73487019
 359.07112525 358.98460222 356.58308089 353.67019505 348.67384286
 344.78329523 343.44479866 346.03834711 348.09272645 351.47563932
 353.76772573 354.17134307 356.28771523 357.51137004 355.45939324
 353.25619921]

6 日期区间
t=
 [ 4  5  6  7  8  9 10 11 12 13 14 15 16 17 18 19 20 21 22 23 24 25 26 27
 28 29]
3.8 布林带
用例:
import numpy as np
from matplotlib.pyplot import plot
from matplotlib.pyplot import show

# 读入文件
str = "样例文件路径"

# 布林带
N = 5
weights = np.ones(N) / N

print("\n\r---------------------------------------------------------------")
print("\n\r布林带\n\r区间\n\rWeights=", weights)

c = np.loadtxt(str, delimiter=',', usecols=(6,), unpack=True)
sma = np.convolve(weights, c)[N - 1:-N + 1]
deviation = []
C = len(c)

for i in range(N - 1, C):
    if i + N < C:
        dev = c[i: i + N]
    else:
        dev = c[-N:]

    averages = np.zeros(N)
    averages.fill(sma[i - N - 1])
    dev = dev - averages
    dev = dev ** 2
    dev = np.sqrt(np.mean(dev))
    deviation.append(dev)

deviation = 2 * np.array(deviation)
print("\n\rlen(deviation)=", len(deviation), "\n\rlen(sma)=", len(sma))
upperBB = sma + deviation
lowerBB = sma - deviation

c_slice = c[N - 1:]
between_bands = np.where((c_slice < upperBB) & (c_slice > lowerBB))

print("\n\r1 下轨道\n\rlowerBB[between_bands]=\n\r", lowerBB[between_bands])
print("\n\rc[between_bands]=\n\r", c[between_bands])
print("\n\r2 上轨道\n\rupperBB[between_bands]=\n\r", upperBB[between_bands])

between_bands = len(np.ravel(between_bands))
print("\n\rRatio between bands=", float(between_bands) / len(c_slice))

t = np.arange(N - 1, C)
plot(t, c_slice, lw=1.0)
plot(t, sma, lw=2.0)
plot(t, upperBB, lw=3.0)
plot(t, lowerBB, lw=4.0)
show()
结果
布林带
区间
Weights= [0.2 0.2 0.2 0.2 0.2]

len(deviation)= 26
len(sma)= 26

1 下轨道
lowerBB[between_bands]=
 [329.23044409 335.70890572 318.53386282 321.90858271 327.74175968
 331.5628136  337.94259734 343.84172744 339.99900409 336.58687297
 333.15550418 328.64879207 323.61483771 327.25667796 334.30323599
 335.79295948 326.55905786 324.27329493 325.47601386 332.85867025
 341.63882551 348.75558399 348.48014357 348.01342992 343.56371701
 341.85163786]

c[between_bands]=
 [336.1  339.32 345.03 344.32 343.44 346.5  351.88 355.2  358.16 354.54
 356.85 359.18 359.9  363.13 358.3  350.56 338.61 342.62 342.88 348.16
 353.21 349.31 352.12 359.56 360.   355.36]

2 上轨道
upperBB[between_bands]=
 [354.05355591 351.73509428 373.93413718 374.62741729 374.33024032
 374.9491864  372.70940266 369.73027256 375.45299591 380.85312703
 385.78849582 387.77920793 384.58516229 374.03132204 358.88476401
 353.33904052 363.63294214 370.19870507 372.79598614 372.08532975
 368.04117449 361.78441601 364.63985643 365.24657008 364.54028299
 363.04836214]
3.9 线性模型
用例:
import numpy as np

# 读入文件
str = "样例文件路径"

# 线性模型
N = 5  # int(sys.argv[1])
print("\n\r线性模型\n\rN=", N)
c = np.loadtxt(str, delimiter=',', usecols=(6,), unpack=True)
b = c[-N:]
b = b[::-1]
print("\n\r第7列数据收市价最高价\n\rc=", c)
print("\n\r1 最后5个数组倒序数组\n\rb=", b)

A = np.zeros((N, N), float)
print("\n\r空矩阵\n\rZeros N by N=", A)

for i in range(N):
    A[i,] = c[-N - 1 - i: - 1 - i]
    print("A[{},]={}".format(i, A[i,]))

print("\n\r2 数组\n\rA=", A)

(x, residuals, rank, s) = np.linalg.lstsq(A, b)
print("\n\rx={}\n\rresiduals={}\n\rrank={}\n\rs={}".format(x, residuals, rank, s))
print("\n\rnp.dot(b, x)=", np.dot(b, x))
结果
线性模型
N= 5

第7列数据收市价最高价
c= [336.1  339.32 345.03 344.32 343.44 346.5  351.88 355.2  358.16 354.54
 356.85 359.18 359.9  363.13 358.3  350.56 338.61 342.62 342.88 348.16
 353.21 349.31 352.12 359.56 360.   355.36 355.76 352.47 346.67 351.99]

1 最后5个数组倒序数组
b= [351.99 346.67 352.47 355.76 355.36]

空矩阵
Zeros N by N= [[0. 0. 0. 0. 0.]
 [0. 0. 0. 0. 0.]
 [0. 0. 0. 0. 0.]
 [0. 0. 0. 0. 0.]
 [0. 0. 0. 0. 0.]]
A[0,]=[360.   355.36 355.76 352.47 346.67]
A[1,]=[359.56 360.   355.36 355.76 352.47]
A[2,]=[352.12 359.56 360.   355.36 355.76]
A[3,]=[349.31 352.12 359.56 360.   355.36]
A[4,]=[353.21 349.31 352.12 359.56 360.  ]

2 数组
A= [[360.   355.36 355.76 352.47 346.67]
 [359.56 360.   355.36 355.76 352.47]
 [352.12 359.56 360.   355.36 355.76]
 [349.31 352.12 359.56 360.   355.36]
 [353.21 349.31 352.12 359.56 360.  ]]

x=[ 0.78111069 -1.44411737  1.63563225 -0.89905126  0.92009049]
residuals=[]
rank=5
s=[1.77736601e+03 1.49622969e+01 8.75528492e+00 5.15099261e+00
 1.75199608e+00]

np.dot(b, x)= 357.9391610152338
3.10 趋势线
用例:
import numpy as np
from matplotlib.pyplot import plot
from matplotlib.pyplot import show

# 读入文件
str = "样例文件路径"

# 趋势线
def fit_line(t, y):
    A = np.vstack([t, np.ones_like(t)]).T
    return np.linalg.lstsq(A, y)[0]

h, l, c = np.loadtxt(str, delimiter=',', usecols=(4, 5, 6), unpack=True)
pivots = (h + l + c) / 3

print("\n\r---------------------------------------------------------------")
print("\n\r线性模型\n\r第5列数据后20天开市价最高价\n\rh=\n\r", h)
print("\n\r第6列数据后20天收市价最低价\n\rl=\n\r", l)
print("\n\r第7列数据收市价最高价\n\rc=\n\r", c)
print("\n\r1 开市最高、收市最低和最高的平均值\n\rPivots=\n\r", pivots)

t = np.arange(len(c))
sa, sb = fit_line(t, pivots - (h - l))
ra, rb = fit_line(t, pivots + (h - l))
print("\n\rsa=", sa)
print("sb=", sb)
print("ra=", ra)
print("rb=", rb)

support = sa * t + sb
resistance = ra * t + rb
condition = (c > support) & (c < resistance)
print("\n\r2 support=\n\r", support)
print("\n\r3 resistance=\n\r", resistance)
print("\n\r4 Condition=\n\r", condition)

between_bands = np.where(condition)
print("\n\r5 support[between_bands]=\n\r", support[between_bands])
print("\n\r6 c[between_bands]=\n\r", c[between_bands])
print("\n\r7 resistance[between_bands]=\n\r", resistance[between_bands])

between_bands = len(np.ravel(between_bands))
print("\n\r8 Number points between bands=", between_bands)
print("\n\r9 Ratio between bands=", float(between_bands) / len(c))
print("\n\r10 Tomorrows support=", sa * (t[-1] + 1) + sb)
print("\n\r11 Tomorrows resistance=", ra * (t[-1] + 1) + rb)

a1 = c[c > support]
a2 = c[c < resistance]
print("\n\r12 a1=\n\r", a1)
print("\n\r13 a2=\n\r", a2)
print("\n\r14 Number of points between bands 2nd approach=", len(np.intersect1d(a1, a2)))

plot(t, c)
plot(t, support)
plot(t, resistance)
show()
结果
线性模型
第5列数据后20天开市价最高价
h=
 [344.4  340.04 345.65 345.25 344.24 346.7  353.25 355.52 359.   360.
 357.8  359.48 359.97 364.9  360.27 359.5  345.4  344.64 345.15 348.43
 355.05 355.72 354.35 359.79 360.29 361.67 357.4  354.76 349.77 352.32]

第6列数据后20天收市价最低价
l=
 [333.53 334.3  340.98 343.55 338.55 343.51 347.64 352.15 354.87 348.
 353.54 356.71 357.55 360.5  356.52 349.52 337.72 338.61 338.37 344.8
 351.12 347.68 348.4  355.92 357.75 351.31 352.25 350.6  344.9  345.  ]

第7列数据收市价最高价
c=
 [336.1  339.32 345.03 344.32 343.44 346.5  351.88 355.2  358.16 354.54
 356.85 359.18 359.9  363.13 358.3  350.56 338.61 342.62 342.88 348.16
 353.21 349.31 352.12 359.56 360.   355.36 355.76 352.47 346.67 351.99]

1 开市最高、收市最低和最高的平均值
Pivots=
 [338.01       337.88666667 343.88666667 344.37333333 342.07666667
 345.57       350.92333333 354.29       357.34333333 354.18
 356.06333333 358.45666667 359.14       362.84333333 358.36333333
 353.19333333 340.57666667 341.95666667 342.13333333 347.13
 353.12666667 350.90333333 351.62333333 358.42333333 359.34666667
 356.11333333 355.13666667 352.61       347.11333333 349.77      ]

sa= 0.2666051167964402
sb= 341.39100358422934
ra= 0.2904449388209168
rb= 352.0359928315411

2 support=
 [341.39100358 341.6576087  341.92421382 342.19081893 342.45742405
 342.72402917 342.99063429 343.2572394  343.52384452 343.79044964
 344.05705475 344.32365987 344.59026499 344.8568701  345.12347522
 345.39008034 345.65668545 345.92329057 346.18989569 346.4565008
 346.72310592 346.98971104 347.25631615 347.52292127 347.78952639
 348.0561315  348.32273662 348.58934174 348.85594685 349.12255197]

3 resistance=
 [352.03599283 352.32643777 352.61688271 352.90732765 353.19777259
 353.48821753 353.77866246 354.0691074  354.35955234 354.64999728
 354.94044222 355.23088716 355.5213321  355.81177704 356.10222198
 356.39266691 356.68311185 356.97355679 357.26400173 357.55444667
 357.84489161 358.13533655 358.42578149 358.71622642 359.00667136
 359.2971163  359.58756124 359.87800618 360.16845112 360.45889606]

4 Condition=
 [False False  True  True  True  True  True False False  True False False
 False False False  True False False False  True  True  True  True False
 False  True  True  True False  True]

5 support[between_bands]=
 [341.92421382 342.19081893 342.45742405 342.72402917 342.99063429
 343.79044964 345.39008034 346.4565008  346.72310592 346.98971104
 347.25631615 348.0561315  348.32273662 348.58934174 349.12255197]

6 c[between_bands]=
 [345.03 344.32 343.44 346.5  351.88 354.54 350.56 348.16 353.21 349.31
 352.12 355.36 355.76 352.47 351.99]

7 resistance[between_bands]=
 [352.61688271 352.90732765 353.19777259 353.48821753 353.77866246
 354.64999728 356.39266691 357.55444667 357.84489161 358.13533655
 358.42578149 359.2971163  359.58756124 359.87800618 360.45889606]

8 Number points between bands= 15

9 Ratio between bands= 0.5

10 Tomorrows support= 349.38915708812254

11 Tomorrows resistance= 360.7493409961686

12 a1=
 [345.03 344.32 343.44 346.5  351.88 355.2  358.16 354.54 356.85 359.18
 359.9  363.13 358.3  350.56 348.16 353.21 349.31 352.12 359.56 360.
 355.36 355.76 352.47 351.99]

13 a2=
 [336.1  339.32 345.03 344.32 343.44 346.5  351.88 354.54 350.56 338.61
 342.62 342.88 348.16 353.21 349.31 352.12 355.36 355.76 352.47 346.67
 351.99]

14 Number of points between bands 2nd approach= 15
