python数据可视化(一)——条形图
条形图 bar
参考资料
bar()函数——python绘制柱状图
python Matplotlib 系列教程(三)——绘制直方图和条形图
在 python 中用 matplotlib 绘图并添加数据标签
Python:(使用matplotlib画图)使用bar画柱状图,并标注数字
python画图--柱状图
Python zip函数及用法
bar(left,height,参数)
例子1
#-*-coding:utf-8-*-
import matplotlib.pyplot as plt
from matplotlib.font_manager import FontProperties
font = FontProperties(fname=r"C:\Windows\Fonts\simhei.ttf",size = 14)
plt.bar([1, 3 ,5, 7, 9],[5, 4, 8, 12, 7],label='graph1')
plt.bar([2, 4, 6, 8, 10],[4, 6, 8, 13, 15],label='graph2')

width:0.5

plt.legend()
plt.xlabel('number')
plt.ylabel('value')
plt.title(u'测试例子——条形图',FontProperties=font)
plt.show()
-
width:条形图的宽度
-
left参数可以为负数

-
yeer: 每根柱子顶端在纵轴方向的线段。如果指定一个固定值,所有柱子的线段将一直长;如果指定一个带有不同长度值的列表,那么柱子顶部的线段将呈现不同长度。
-
bottom:指定堆叠的基准
-
只有使用 np.array 才能对数组内元素进行加减
-
align 对齐方式,默认为center
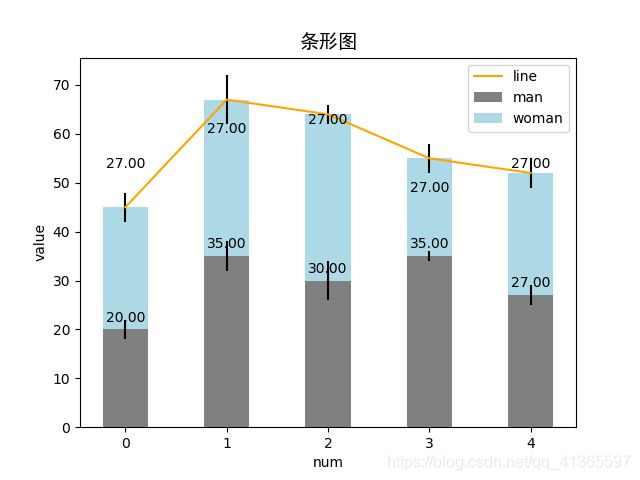
例子2
#-*-coding:utf-8-*-
import numpy as np
import matplotlib.pyplot as plt
from matplotlib.font_manager import FontProperties
font = FontProperties(fname=r"C:\Windows\Fonts\simhei.ttf",size = 14)
n = 5
a = np.array([20,35,30,35,27])
b = np.array([25,32,34,20,25])
c = (2,3,4,1,2)
d = (3,5,2,3,3)
e = a+b
print(e)
ind = np.arange(n)
width = 0.45

p1 = plt.bar(ind,a,width,color = 'grey',yerr = c,label = "man",align ='center')
p2 = plt.bar(ind,b,width,color = 'lightblue',bottom = a,yerr = d,label='woman')
p3 = plt.plot(ind,e,color='#FFA500',label='line')

for x,y in zip(ind,a):
	plt.text(x,y+1,'%.2f' %y,ha = 'center',va = 'bottom')
for x1,y1 in zip(ind,b):
	plt.text(x1,y+y1+0.5,'%.2f' %y,ha = 'center',va = 'bottom')

plt.title('条形图',FontProperties=font)
plt.xlabel('num')
plt.ylabel('value')
plt.legend()
plt.show()
-
添加数据标签:
for x,y in zip(ind,a): plt.text(x,y+0.05,'%.2f' %y,ha = 'center',va = 'bottom')-
zip函数
-
plt.text函数
-

