机器学习项目复盘之“鸢尾花分类”
前几周,在机器学习课程上面做了一些简单的项目。期间,自然是痛并快乐着的。但是,这段时间,终究是熬过来啦!很多人都把“鸢尾花分类”比作机器学习里面的“hello world”,我也深深地认同这点。当然,或许你会加上“波士顿房价回归”,“手写数字识别”啥的。但是,no problem,后面我会把这些“hello world”全都复盘一遍,哈哈,谁让我是小菜鸡呢^_~
没错,这一次,我写的就是“鸢尾花”。
项目地址是这个,点我哦百度AI
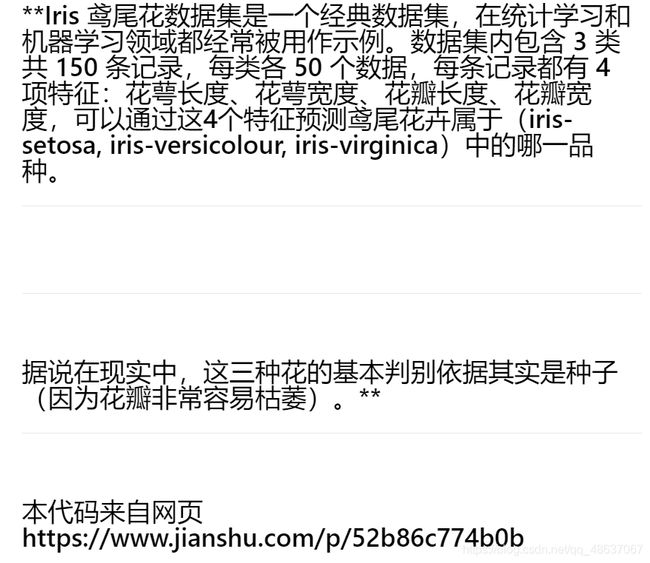
先给出本次实验的相关介绍
 接着,就是相关代码了,如下:
先调用相关包
import numpy as np #Numpy是Python的一个扩展包,支持高维数组和矩阵运算,也提供了许多数组和矩阵运算的函数
import pandas as pd #pandas是一个python的扩展包,是基于numpy的一种工具,提供了快速、灵活和富有表现力的数据结构,是强大而有效的数据分析工具
from pandas import plotting #pandas中的一个绘图模块
from sklearn import datasets #sklearn中的数据集库模块
%matplotlib inline #当你调用matplotlib.pyplot的绘图函数plot()进行绘图的时候,或者生成一个figure画布的时候,可以直接在你的python console里面生成图像
import matplotlib.pyplot as plt #以plt代表调用matplotlib.pyplot,这是python中的一个绘图包
plt.style.use('seaborn') #定义画布的呈现风格
import seaborn as sns #以sns代表调用seaborn包,seaborn包是对matplotlib的增强版,需要安装matplotlib后才能使用
sns.set_style('whitegrid') #定义风格
from sklearn.linear_model import LogisticRegression #调用LogisticRegression模块,用于LogisticRegression回归
from sklearn.model_selection import train_test_split #该模块用于分割数据
from sklearn.preprocessing import LabelEncoder #将标签分配一个0—n_classes-1之间的编码
from sklearn.neighbors import KNeighborsClassifier #K近邻算法模块
from sklearn import svm #支持向量机模块
from sklearn import metrics #metrics是sklearn用来做模型评估的重要模块,提供了各种评估度量
from sklearn.tree import DecisionTreeClassifier #决策树分类器模块
接着,加载数据集,并将数据集里面的字符串转变为整型,这样便于进行分析。
def iris_type(s): #将三种鸢尾花的名称转变为0,1,2三个数字
	it = {
     b'Iris-setosa':0, b'Iris-versicolor':1, b'Iris-virginica':2}
	return it[s]
data_path = '/home/aistudio/data/data5420/iris.data' #这里是数据集的路径
data = np.loadtxt(data_path, dtype=float, delimiter=',', converters={
     4:iris_type}) #将第5列使用函数iris_type进行转换
print(len(data)) #查看数据集长度
iris = pd.read_csv(data_path, header=None) #不要第一行,避免第一行名称也被当做数据
iris.columns = ['SepalLengthCm', 'SepalWidthCm', 'PetalLengthCm', 'PetalWidthCm', 'Species']  #给数据加上标题
#接下来查看一下数据的特征
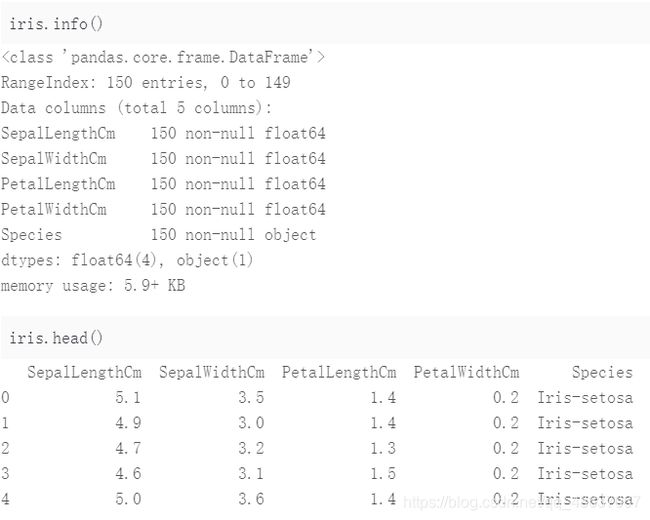
iris.info()
iris.head()
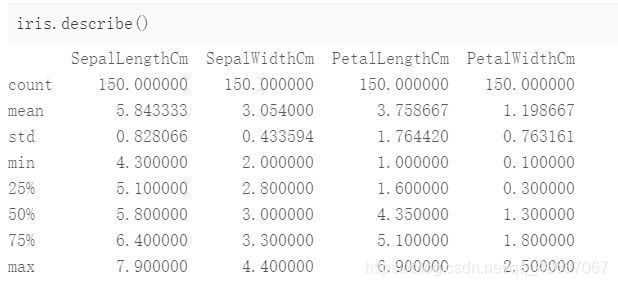
iris.describe()
#设置颜色主题
anTV = ['#1890FF', '#2FC25B', '#FACC14', '#223273', '#8543E0', '#13C2C2', '#3436c7', '#F04864']
# 绘制  Violinplot
f, axes = plt.subplots(2, 2, figsize=(8, 8), sharex=True)
sns.despine(left=True)
sns.violinplot(x='Species', y='SepalLengthCm', data=iris, palette=antV, ax=axes[0, 0]) #花萼长度
sns.violinplot(x='Species', y='SepalWidthCm', data=iris, palette=antV, ax=axes[0, 1])  #花萼宽度
sns.violinplot(x='Species', y='PetalLengthCm', data=iris, palette=antV, ax=axes[1, 0])  #花瓣长度
sns.violinplot(x='Species', y='PetalWidthCm', data=iris, palette=antV, ax=axes[1, 1])  #花萼宽度
plt.show()
#绘制pointplot
f, axes = plt.subplots(2, 2, figsize=(8, 8), sharex=True)
sns.despine(left=True)
sns.pointplot(x='Species', y='SepalLengthCm', data=iris, color=antV[0], ax=axes[0, 0])
sns.pointplot(x='Species', y='SepalWidthCm', data=iris, color=antV[0], ax=axes[0, 1])
sns.pointplot(x='Species', y='PetalLengthCm', data=iris, color=antV[0], ax=axes[1, 0])
sns.pointplot(x='Species', y='PetalWidthCm', data=iris, color=antV[0], ax=axes[1, 1])
plt.show()
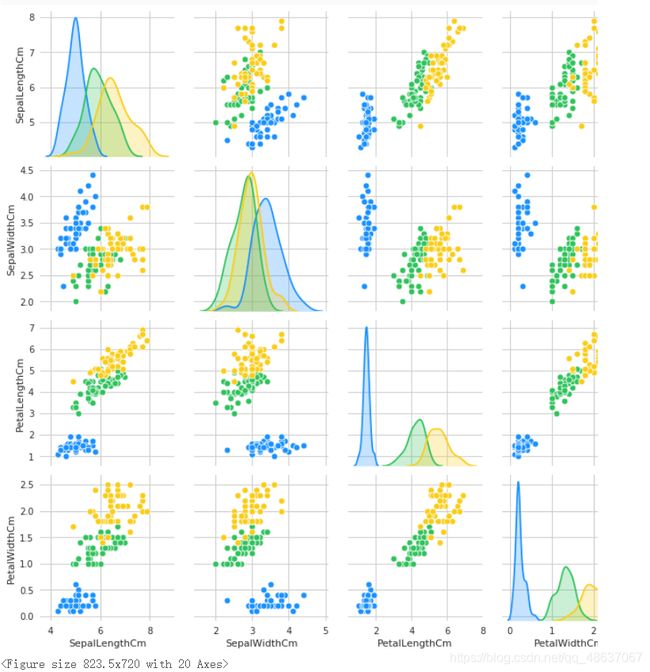
g = sns.pairplot(data=iris, palette=antV, hue='Species')
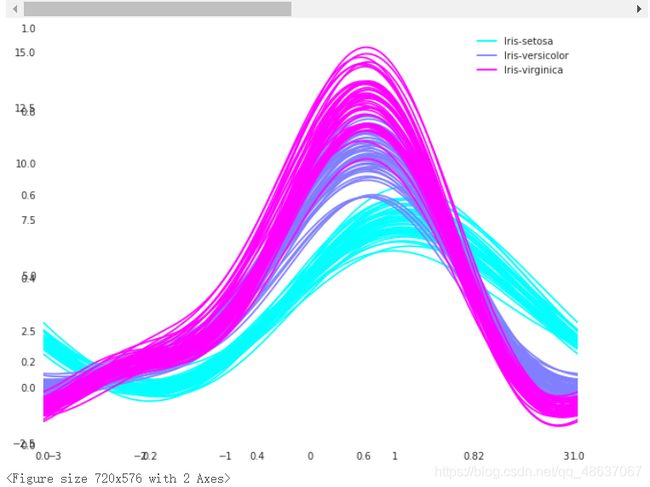
 使用 Andrews Curves 将每个多变量观测值转换为曲线并表示傅立叶级数的系数,这对于检测时间序列数据中的异常值很有用。
Andrews Curves 是一种通过将每个观察映射到函数来可视化多维数据的方法。
plt.subplots(figsize = (10,8))
plotting.andrews_curves(iris, 'Species', colormap='cool')
plt.show()
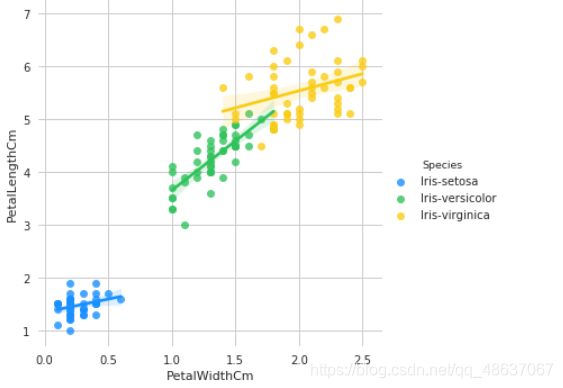
g = sns.lmplot(data=iris, x='SepalWidthCm', y='SepalLengthCm', palette=antV, hue='Species')
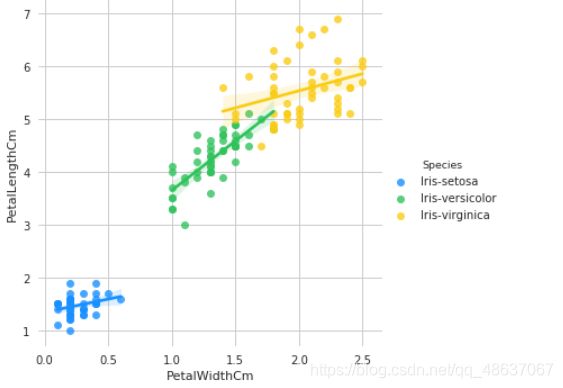
g = sns.lmplot(data=iris, x='PetalWidthCm', y='PetalLengthCm', palette=antV, hue='Species')
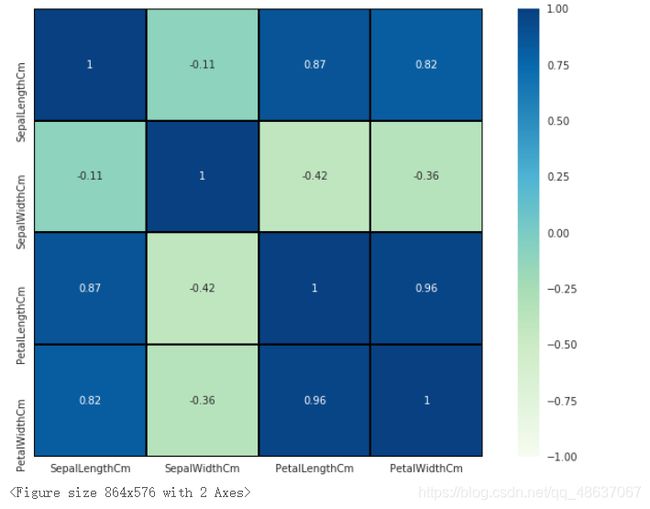
最后是利用热力图来看特征之间的相关性,热力图在特征工程中是极为常用的,在我的上一篇文章“研究美国大选”中也运用了热力图。
fig=plt.gcf()
fig.set_size_inches(12, 8)
fig=sns.heatmap(iris.corr(), annot=True, cmap='GnBu', linewidths=1, linecolor='k', square=True, mask=False, vmin=-1, vmax=1, cbar_kws={
     "orientation": "vertical"}, cbar=True)
接下来,通过机器学习,以花萼和花瓣的尺寸为根据,预测其品种。
在进行机器学习之前,将数据集拆分为训练和测试数据集。首先,使用标签编码将 3 种鸢尾花的品种名称转换为分类值(0, 1, 2)。
#载入标签和数据集
X = iris[['SepalLengthCm', 'SepalWidthCm', 'PetalLengthCm', 'PetalWidthCm']]
y = iris['Species']
# 对标签集进行编码
encoder = LabelEncoder()
y = encoder.fit_transform(y)
接着,将数据集以 7: 3 的比例,拆分为训练数据和测试数据
train_X, test_X, train_y, test_y = train_test_split(X, y, test_size=0.3, random_state=101)
接下来,就代入不同模型开始跑了。
#支持向量机模型
model = svm.SVC()
model.fit(train_X,train_y)
prediction = model.predict(test_X)
print('The accuracy of the SVM is: {0}'.format(metrics.accuracy_score(prediction,test_y)))
#logistic regression模型
model = LogisticRegression()
model.fit(train_X, train_y)
prediction = model.predict(test_X)
print('The accuracy of the Logistic Regression is: {0}'.format(metrics.accuracy_score(prediction,test_y)))
#决策树模型
model = DecisionTreeClassifier()
model.fit(train_X, train_y)
prediction = model.predict(test_X)
print('The accuracy of the Decision Tree is: {0}'.format(metrics.accuracy_score(prediction,test_y)))
#KNN近邻算法
model = KNeighborsClassifier(n_neighbors=3) #k值大小设置为3
model.fit(train_X, train_y)
prediction = model.predict(test_X)
print('The accuracy of the KNN is: {0}'.format(metrics.accuracy_score(prediction,test_y)))
当然,上面使用了数据集的所有特征,你也可以只分别使用花瓣和花萼的尺寸进行预测。你可以依据花瓣和花萼分别生成新的数据集,然后将新的数据集分别代入以上的模型中,就可以啦。
'''
你可以像下面的代码一样进行转化。
'''
petal = iris[['PetalLengthCm', 'PetalWidthCm', 'Species']]
train_p,test_p=train_test_split(petal,test_size=0.3,random_state=0)
train_x_p=train_p[['PetalWidthCm','PetalLengthCm']]
train_y_p=train_p.Species
test_x_p=test_p[['PetalWidthCm','PetalLengthCm']]
test_y_p=test_p.Species

sepal = iris[['SepalLengthCm', 'SepalWidthCm', 'Species']]
train_s,test_s=train_test_split(sepal,test_size=0.3,random_state=0)
train_x_s=train_s[['SepalWidthCm','SepalLengthCm']]
train_y_s=train_s.Species
test_x_s=test_s[['SepalWidthCm','SepalLengthCm']]
test_y_s=test_s.Species
在接下来的文章中,我会试着用岭回归等方法对模型的预测做出进一步的优化,尝试着提高一下模型的准确率。
