多元统计分析与R语言建模复习笔记
多元统计分析与R语言建模复习笔记
参考资料:
多元统计分析及R语言建模
王斌会教授
视频:
https://www.icourse163.org/learn/JNU-1002335007#/learn/content?type=detail&id=1007583075&sm=1
资源:
http://rstat.leanote.com/cate/多元统计分析
4. 多元相关与回归分析及R使用
> x=c(171,175,159,155,152,158,154,164,168,166,159,164)
> y=c(57,64,41,38,35,44,41,51,57,49,47,46)
> plot(x,y)
> cor(x,y)
[1] 0.9593031
> cor.test(x,y) # 相关系数的假设检验

	Pearson's product-moment correlation

data:  x and y
t = 10.743, df = 10, p-value = 8.21e-07
alternative hypothesis: true correlation is not equal to 0
95 percent confidence interval:
 0.8574875 0.9888163
sample estimates:
      cor
0.9593031
回归系数的假设检验
> d4.3=read.table('clipboard',header = T)
> d4.3
            y        x
1978  11.3262   5.1928
1979  11.4638   5.3782
1980  11.5993   5.7170
1981  11.7579   6.2989
1982  12.1233   7.0002
1983  18.6695   7.5559
1984  16.4286   9.4735
1985  20.0482  20.4079
1986  21.2201  20.9073
1987  21.9935  21.4036
1988  23.5724  23.9047
1989  26.6490  27.2740
1990  29.3710  28.2187
1991  31.4948  29.9017
1992  34.8337  32.9691
1993  43.4895  42.5530
1994  52.1810  51.2688
1995  62.4220  60.3804
1996  74.0799  69.0982
1997  86.5114  82.3404
1998  98.7595  92.6280
1999 114.4408 106.8258
2000 133.9523 125.8151
2001 163.8604 153.0138
2002 189.0364 176.3645
2003 217.1525 200.1731
2004 263.9647 241.6568
2005 316.4929 287.7854
2006 387.6020 348.0435
2007 513.2178 456.2197
2008 613.3035 542.1962
> m4.3=lm(y~x,data=d4.3)
> m4.3

Call:
lm(formula = y ~ x, data = d4.3)

Coefficients:
(Intercept)            x
     -1.197        1.116

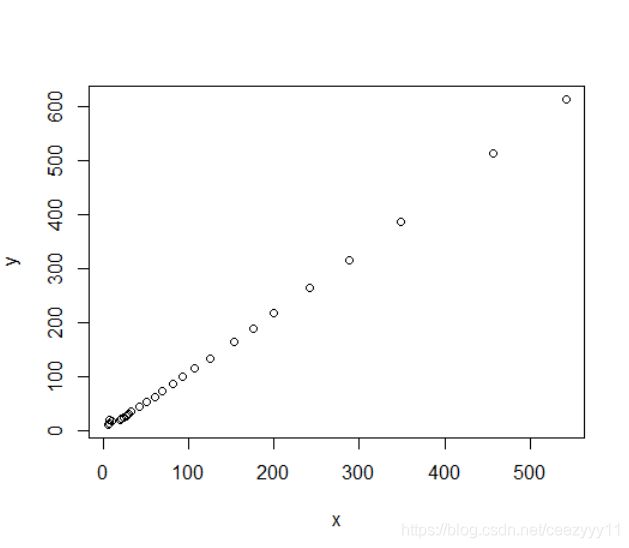
> plot(y~x,data=d4.3)
> abline(m4.3) # 添加回归线
> summary(m4.3) # 回归方程的假设检验

Call:
lm(formula = y ~ x, data = d4.3)

Residuals:
   Min     1Q Median     3Q    Max
-6.630 -3.692 -1.535  5.338 11.432

Coefficients:
            Estimate Std. Error t value Pr(>|t|)
(Intercept) -1.19656    1.16125   -1.03    0.311
x            1.11623    0.00674  165.61   <2e-16 ***
---
Signif. codes:  0 ‘***’ 0.001 ‘**’ 0.01 ‘*’ 0.05 ‘.’ 0.1 ‘ ’ 1

Residual standard error: 5.095 on 29 degrees of freedom
Multiple R-squared:  0.9989,	Adjusted R-squared:  0.9989
F-statistic: 2.743e+04 on 1 and 29 DF,  p-value: < 2.2e-16
6.1 线性判别分析
> d6.1 = read.table('clipboard',header = T)
> d6.1
   G    x1   x2
1  1  -1.9  3.2
2  1  -6.9  0.4
3  1   5.2  2.0
4  1   5.0  2.5
5  1   7.3  0.0
6  1   6.8 12.7
7  1   0.9 -5.4
8  1 -12.5 -2.5
9  1   1.5  1.3
10 1   3.8  6.8
11 2   0.2  6.2
12 2  -0.1  7.5
13 2   0.4 14.6
14 2   2.7  8.3
15 2   2.1  0.8
16 2  -4.6  4.3
17 2  -1.7 10.9
18 2  -2.6 13.1
19 2   2.6 12.8
20 2  -2.8 10.0
> attach(d6.1)
The following objects are masked _by_ .GlobalEnv:

    x1, x2

> plot(x1,x2)
> plot(d6.1$x1,d6.1$x2)
> library(MASS)
> ld = lda(G~x1+x2)
Error in model.frame.default(formula = G ~ x1 + x2) :
  变数的长度不一样('x1')
> ld = lda(G~d6.1$x1+d6.1$x2)
> ld
Call:
lda(G ~ d6.1$x1 + d6.1$x2)

Prior probabilities of groups:
  1   2
0.5 0.5

Group means:
  d6.1$x1 d6.1$x2
1    0.92    2.10
2   -0.38    8.85

Coefficients of linear discriminants:
               LD1
d6.1$x1 -0.1035305
d6.1$x2  0.2247957
> lp=predict(ld)
> lp
$class
 [1] 1 1 1 1 1 2 1 1 1 1 2 2 2 2 1 2 2 2 2 2
Error in if (n <= 1L || lenl[n] <= width) n else max(1L, which.max(lenl >  :
  missing value where TRUE/FALSE needed
> lp$class
 [1] 1 1 1 1 1 2 1 1 1 1 2 2 2 2 1 2 2 2 2 2
Levels: 1 2
> data.frame(G,lp$class)
   G lp.class
1  1        1
2  1        1
3  1        1
4  1        1
5  1        1
6  1        2
7  1        1
8  1        1
9  1        1
10 1        1
11 2        2
12 2        2
13 2        2
14 2        2
15 2        1
16 2        2
17 2        2
18 2        2
19 2        2
20 2        2
快速聚类法
> d7.2=read.table('clipboard',header = T)
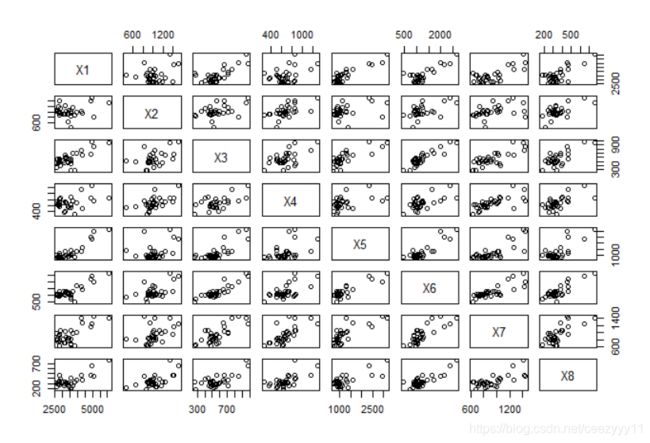
> plot(d7.2)
> install.packages("D:/Programing/多元统计分析与R语言/例题数据/mvstats.zip", repos = NULL, type = "win.binary")
Installing package into ‘C:/Users/Lenovo/Documents/R/win-library/3.5’
(as ‘lib’ is unspecified)
package ‘mvstats’ successfully unpacked and MD5 sums checked
> library(mvstats)
> H.clust(d7.2,m='single',plot=T)

Call:
hclust(d = D, method = m)

Cluster method   : single
Distance         : euclidean
Number of objects: 31


