matplotlib绘图无法显示中文问题的解决方法
matplotlib绘图无法显示中文问题的解决方法
话不多说了,直接上解决方法:
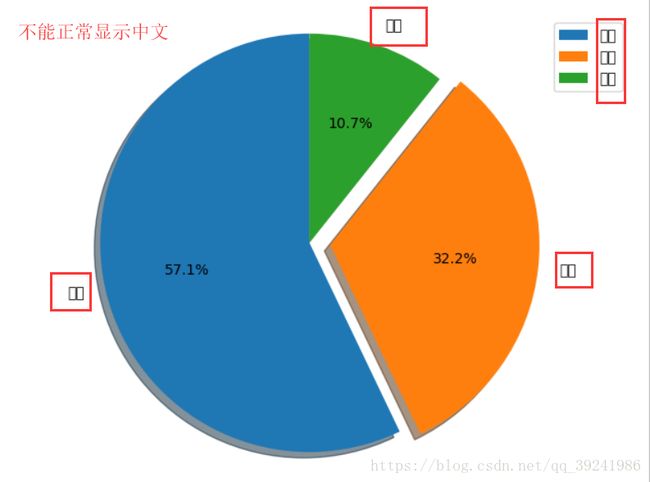
- 源码
import matplotlib.pyplot as plt

labels = ['男性', '女性', '其他']
sizes = [57.1, 32.2, 10.7]
explode = (0, 0.1, 0)

fig1, ax1 = plt.subplots()
ax1.pie(sizes, explode=explode, labels=labels, autopct='%1.1f%%',
        shadow=True, startangle=90)
# 纵横相等,画成一个圆
ax1.axis('equal')
plt.legend()
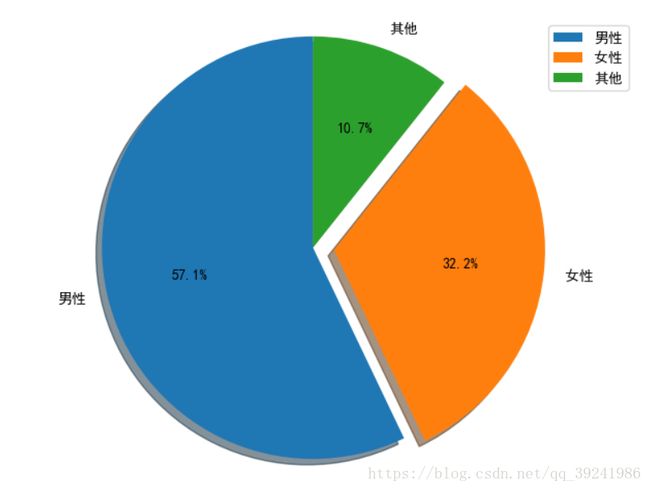
plt.show()from pylab import *
mpl.rcParams['font.sans-serif'] = ['SimHei']
import matplotlib.pyplot as plt
labels = ['男性', '女性', '其他']
sizes = [57.1, 32.2, 10.7]
explode = (0, 0.1, 0)
fig1, ax1 = plt.subplots()
ax1.pie(sizes, explode=explode, labels=labels, autopct='%1.1f%%',
shadow=True, startangle=90)
# 纵横相等,画成一个圆
ax1.axis('equal')
plt.legend()
plt.show()方法学习自脚本之家
原文地址:https://www.jb51.net/article/136397.htm

