ggplot2 绘制 相关矩阵图
文章目录
- ggcorr()
- ggcorrplot()
- ggpairs()
- ggcor()
-
- 相关系数矩阵
- Mantel检验
- 环形热图
- 一般热图
ggcorr()
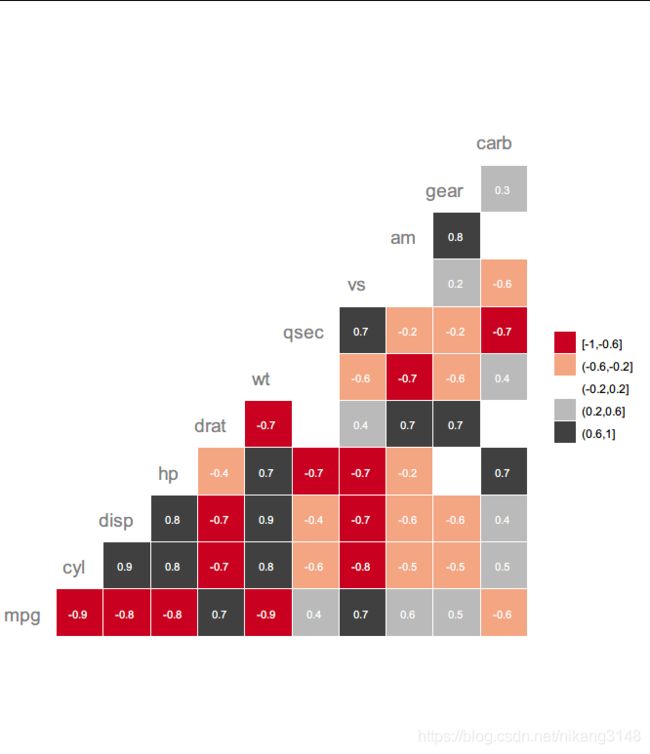
ggcorr(mtcars, nbreaks = 5,
       palette = "RdGy",
       geom = "tile", #text, blank, tile, circle
       label = TRUE, label_size = 3, label_color = "white", #系数标签
       hjust = 0.75, size = 5, color = "grey50" #变量标签
       )
ggcorrplot()
比较简单的是调用ggcorrplot包的相关函数,复杂的可视化可采样ggcor包。
library(ggcorrplot)
#计算相关矩阵(cor()计算结果不提供p-value)
data("mtcars")
corr <- round(cor(mtcars), 1) #相关矩阵
p.mat <- cor_pmat(mtcars) #计算p值
#重排矩阵,使用分等级聚类
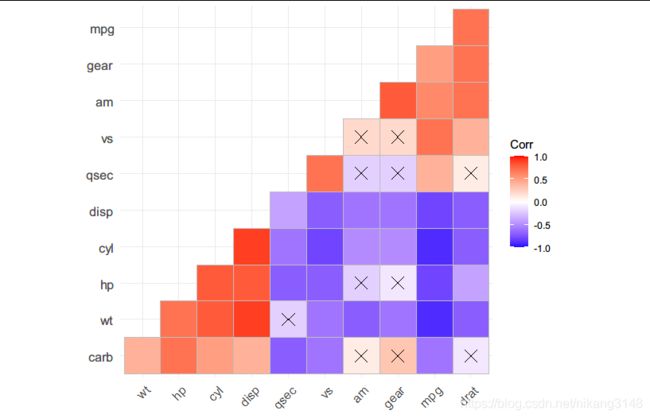
ggcorrplot(corr, hc.order = TRUE, type = "lower", p.mat = p.mat)
ggpairs()
library(GGally)
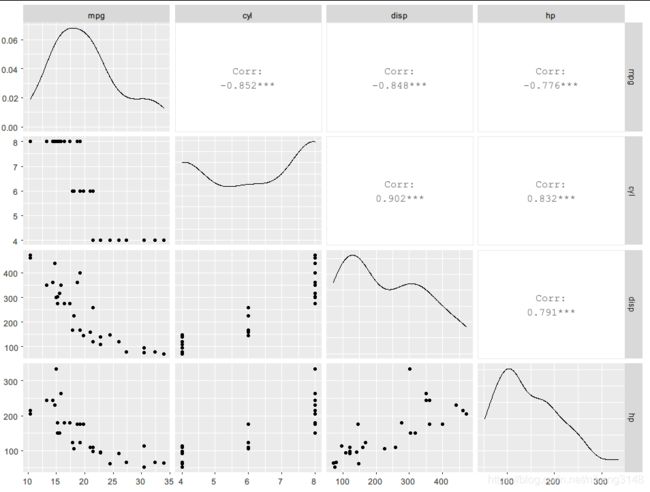
ggpairs(mtcars[,1:4])
#上三角表示各个因素之间的相关性系数,对角线就是各个因素的密度图,
#下三角就是任意两个元素绘成的散点图
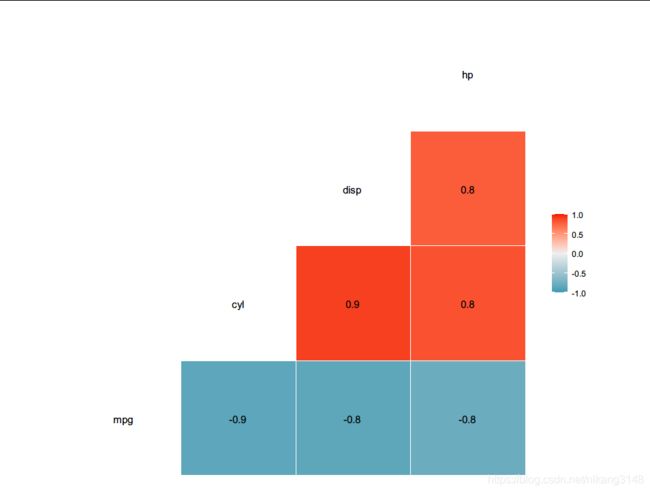
ggcorr(mtcars[,1:4], method = c("everything", "pearson"),label = T)
ggcor()
ggcor包可以实现更复杂的相关系数矩阵可视化。
相关系数矩阵
devtools::install_github("houyunhuang/ggcor")
library(ggcor)
library(vegan)
quickcor(iris[,-5]) + geom_square()
quickcor(iris[,-5]) + geom_color()
quickcor(iris[,-5]) + geom_pie2()
quickcor(iris[,-5]) + geom_ellipse2()
quickcor(iris[,-5]) + geom_circle2()
quickcor(iris[,-5]) + geom_number(aes(num=r))
quickcor(iris[,-5],cor.test=T) + geom_confbox()
quickcor(iris[,-5],cor.test=T) + geom_mark()
quickcor(iris[,-5],cor.test=T,type="upper") + geom_color()+geom_mark()
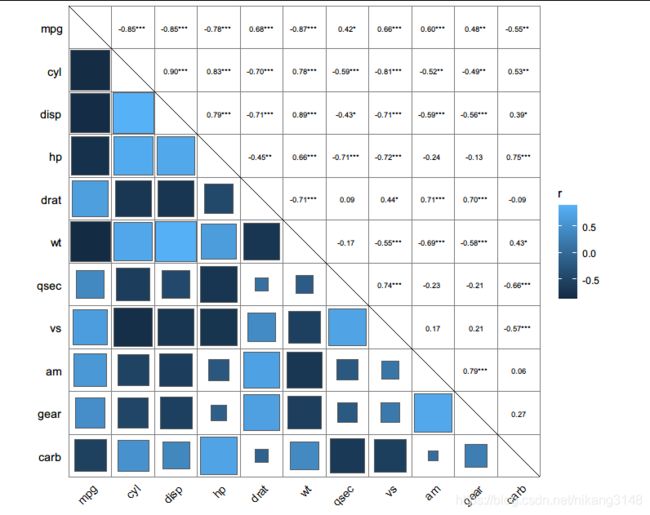
quickcor(mtcars, cor.test = TRUE) +
  geom_square(data = get_data(type = "lower", show.diag = FALSE)) +
  geom_mark(data = get_data(type = "upper", show.diag = FALSE), size = 2.5) +
  geom_abline(slope = -1, intercept = 12)
Mantel检验
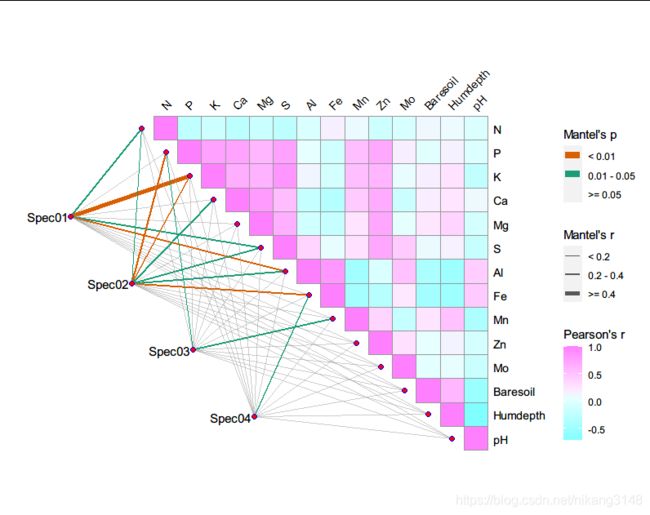
ggcor包神奇的是可以实现mantel置换检验可视化,以vegan包种的数据为例:
data("varechem", package = "vegan")
data("varespec", package = "vegan")
mantel <- mantel_test(varespec, varechem,
                      spec.select = list(Spec01 = 1:7,
                                         Spec02 = 8:18,
                                         Spec03 = 19:37,
                                         Spec04 = 38:44)) %>%
  mutate(rd = cut(r, breaks = c(-Inf, 0.2, 0.4, Inf),
                  labels = c("< 0.2", "0.2 - 0.4", ">= 0.4")),
         pd = cut(p.value, breaks = c(-Inf, 0.01, 0.05, Inf),
                  labels = c("< 0.01", "0.01 - 0.05", ">= 0.05")))

quickcor(varechem, type = "upper") +
  geom_color() +
  scale_fill_gradientn(colours =cm.colors(10))+
  anno_link(aes(colour = pd, size = rd), data = mantel) +
  scale_size_manual(values = c(0.5, 1, 2)) +
  scale_colour_manual(values = c("#D95F02", "#1B9E77", "#A2A2A288")) +
  guides(size = guide_legend(title = "Mantel's r",
                             override.aes = list(colour = "grey35"),
                             order = 2),
         colour = guide_legend(title = "Mantel's p",
                               override.aes = list(size = 3),
                               order = 1),
         fill = guide_colorbar(title = "Pearson's r", order = 3))
环形热图
library(ambient)
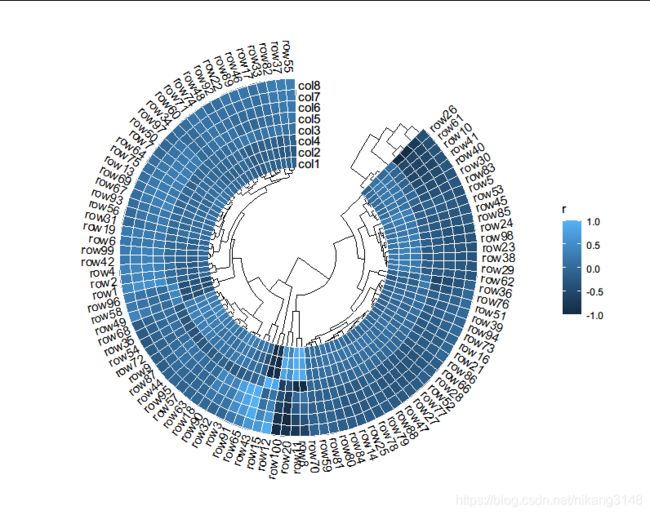
rand_correlate(100, 8) %>% ## require ambient packages
  quickcor(circular = TRUE, cluster = TRUE, open = 45) +
  geom_colour(colour = "white", size = 0.125) +
  anno_row_tree() +
  anno_col_tree() +
  set_p_xaxis() +
  set_p_yaxis()
一般热图
d1 <- rand_dataset(20, 30) %>%
  gcor_tbl(cluster = TRUE)
p <- matrix(sample(LETTERS[1:4], 90, replace = TRUE), nrow = 30,
             dimnames = list(paste0("sample", 1:30), paste0("Type", 1:3))) %>%
  gcor_tbl(name = "Type", row.order = d1) %>%
  qheatmap(aes(fill = Type)) + coord_fixed() + remove_y_axis()
d2 <- data.frame(x = sample(paste0("var", 1:20), 200, replace = TRUE))

set_scale()
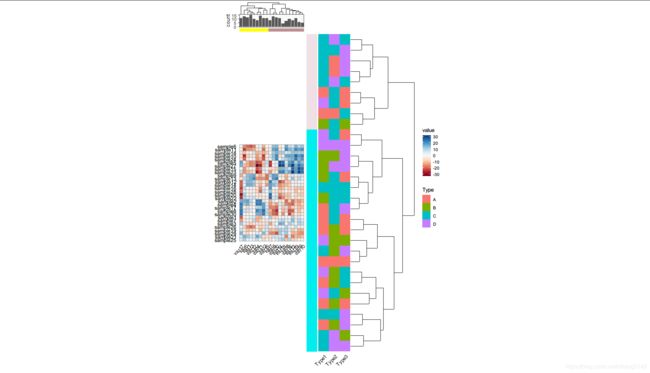
quickcor(d1) +
  geom_colour(aes(fill = value)) +
  anno_hc_bar(width = 1) +
  anno_row_custom(p) +
  anno_row_tree() +
  anno_hc_bar(pos = "top") +
  anno_bar(d2, aes(x = x), height = 0.12) +
  anno_col_tree(height = 0.12)
