highcharts-wordcloud 词云图

一、前言

网上查了下文档,在highcharts中文文档没有,最新的英文文档可以看到。下面就我使用到的功能写的比较简单的实用demo

二、使用技术以及版本

使用技术vue+highcharts,并没有用vue定制的版本,所以可以直接按照官网配置来(需要vue定制的版本点我)。要注意词云图使用的highcharts版本,我看到官网使用的是7.2.1,所以最好用这个及以上

三、实例demo

1)我是vue框架使用import引入的(当然你也可以使用script引入)

   a)安装

npm install [email protected]

   b)引入

import Highcharts from "highcharts/highcharts";
import wordcloud from "highcharts/modules/wordcloud";

wordcloud(Highcharts);

2)html

3)js

export default {
        name: "wordCloud",
        data(){
            return{
                wordCloudData : [
                    {
                        id: "1",
                        content: "老铁稳!"
                    },
                    {
                        id: "2",
                        content: "AWSL"
                    },
                    {
                        id: "3",
                        content: "阿伟死了"
                    },
                    {
                        id: "4",
                        content: "完结散花"
                    },
                    {
                        id: "5",
                        content: "穷人解禁"
                    },
                    {
                        id: "6",
                        content: "奥利给"
                    },
                    {
                        id: "7",
                        content: "前方十条弹幕,请做好战斗准备"
                    },
                    {
                        id: "8",
                        content: "空降失败"
                    },
                    {
                        id: "9",
                        content: "指挥部:空降地点1\'20"
                    },
                    {
                        id: "10",
                        content: "上海机场"
                    }
                ],
            }
        },
        mounted(){
            this.$nextTick(() => {
                this.dealData()
            }, 1000);
        },
        methods: {
            dealData(){
                let data = this.wordCloudData.reduce(function (arr, word){
                    let obj = {
                        name: word.content,
                        itemData: word,
                        weight: Math.floor(Math.random()*3+1)//控制加粗,随机数取1~3
                    };
                    arr.push(obj);
                    return arr;
                }, []);
                this.drawPic(data)
            },
            drawPic(data){
                Highcharts.chart('container', {
                    //highcharts logo
                    credits: { enabled: false },
                    //导出
                    exporting: { enabled: false },
                    //提示关闭
                    tooltip: { enabled: false },
                    //颜色配置
                    colors:[
                        '#ffffff','#00c0d7','#2594ce','#de4c85',
                        '#ff7f46','#ffb310','#e25c52'
                    ],
                    //图形配置
                    chart: {
                        spacingBottom: 15,
                        spacingTop: 12,
                        // spacingLeft: 5,
                        // spacingRight: 5,
                        backgroundColor: "rgba(0, 0, 0,0.5)",
                    },

                    series: [{
                        type: "wordcloud",// 类型
                        data: data,
                        rotation: 0,//字体不旋转
                        maxFontSize: 30,//最大字体
                        minFontSize: 16,//最小字体
                        style: {
                            fontFamily: "微软雅黑",
                            fontWeight: '500'
                        }
                    }
                    ],
                    //点击事件方法
                    plotOptions: {
                        series: {
                            cursor: 'pointer',
                            events: {
                                click: function (e){
                                    // 单条数据
                                    console.log(e.point.options.itemData)
                                }
                            }
                        }
                    },

                    //标题配置
                    title: {
                        text: 'REC ●',
                        // x: 5,
                        // y: 15,
                        align: 'left',
                        style: {
                            color: 'red',
                            fontSize: '16px',
                            fontWeight: 'bold',
                            lineHeight: '1.2',
                        }
                    }
                });
            }
        }
    }

三、总结

网上搜的echart词云图比较多,但是对于项目来说,既然已经选用的highchart,那就好好看下。

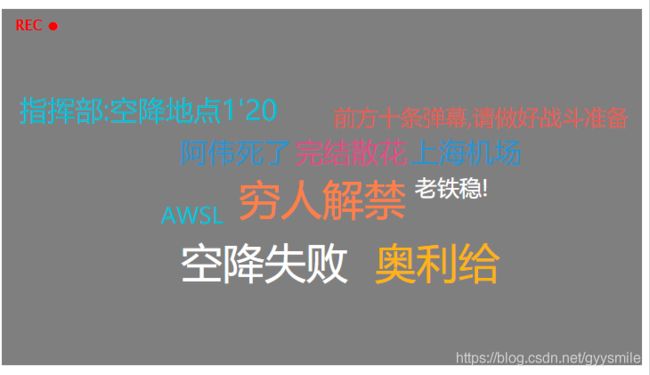
预览图如下

highcharts-wordcloud 词云图_第1张图片

整体写下来感觉有个缺点:如果加粗也随机的话,感觉位置就跟着随机了,不是居中一团显示,没找到配置属性,望有兴趣的同学找找告知下,谢谢了!官网的demo传送门>>    代码示例传送门>>
你可能感兴趣的:(#highcharts,前端开发,highcharts,wordcloud)