机器学习——线性回归(吴恩达老师视频总结和练习代码)
线性回归的代价函数:
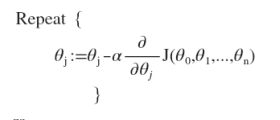
线性回归的迭代过程:
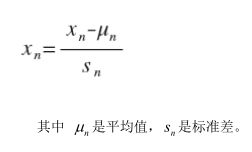
特征值缩放:
学习率:
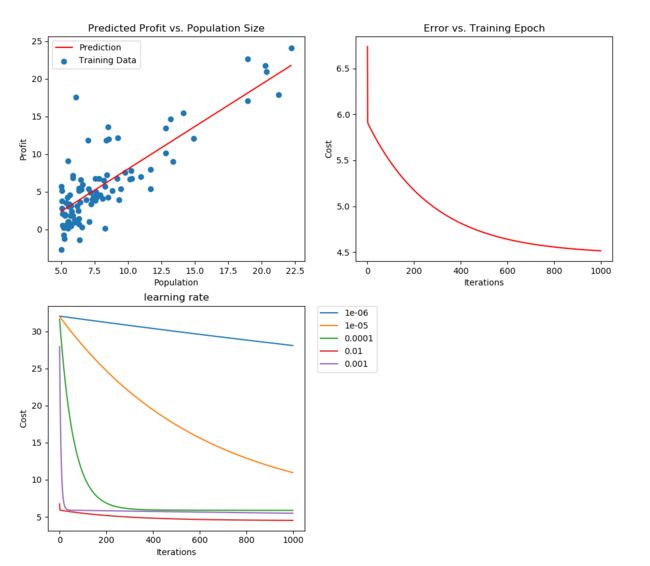
如果学习率 α 过小, 则达到收敛所需的迭代次数会非常高;如果学习率 α 过大,每次迭代可能不会减小代价函数,可能会越过局部最小值导致无法收敛。
特征和多项式回归:
正规方程:
扩展知识:
这里知乎上有个问题很好的解释最小二乘法,这个跟正规方程有很多相关的地方,值得一看:
https://www.zhihu.com/question/37031188/answer/111336809
还有一个知乎问题关于泰勒公式的,数学知识忘记得差不多的可以看看:
https://www.zhihu.com/question/21149770
下面是作业的代码:
# -*- coding: utf-8 -*-
"""
__author__ = 'ljyn4180'
"""

import numpy as np
import pandas as pd
import matplotlib.pyplot as plt


# 代价函数
def CostFunction(matrixX, matrixY, matrixTheta):
    Inner = np.power(((matrixX * matrixTheta.T) - matrixY), 2)
    return np.sum(Inner) / (2 * len(matrixX))


# 梯度下降迭代函数
def GradientDescent(matrixX, matrixY, matrixTheta, fAlpha, nIterCounts):
    matrixThetaTemp = np.matrix(np.zeros(matrixTheta.shape))
    nParameters = int(matrixTheta.ravel().shape[1])
    arrayCost = np.zeros(nIterCounts)

    for i in xrange(nIterCounts):
        matrixError = (matrixX * matrixTheta.T) - matrixY

        for j in xrange(nParameters):
            matrixSumTerm = np.multiply(matrixError, matrixX[:, j])
            matrixThetaTemp[0, j] = matrixTheta[0, j] - fAlpha / len(matrixX) * np.sum(matrixSumTerm)

        matrixTheta = matrixThetaTemp
        arrayCost[i] = CostFunction(matrixX, matrixY, matrixTheta)

    return matrixTheta, arrayCost


# 显示线性回归结果
def ShowLineRegressionResult(dataFrame, matrixTheta):
    x = np.linspace(dataFrame.Population.min(), dataFrame.Population.max(), 100)
    f = matrixTheta[0, 0] + (matrixTheta[0, 1] * x)

    plt.subplot(221)
    plt.plot(x, f, 'r', label='Prediction')
    plt.scatter(dataFrame.Population, dataFrame.Profit, label='Training Data')
    plt.legend(loc=2)
    plt.xlabel('Population')
    plt.ylabel('Profit')
    plt.title('Predicted Profit vs. Population Size')


# 显示代价函数的值的变化情况
def ShowCostChange(arrayCost, nIterCounts):
    plt.subplot(222)
    plt.plot(np.arange(nIterCounts), arrayCost, 'r')
    plt.xlabel('Iterations')
    plt.ylabel('Cost')
    plt.title('Error vs. Training Epoch')


# 显示不同Alpha值得学习曲线
def ShowLearningRateChange(dictCost, nIterCounts):
    plt.subplot(223)
    for fAlpha, arrayCost in dictCost.iteritems():
        plt.plot(np.arange(nIterCounts), arrayCost, label=fAlpha)
    plt.xlabel('Iterations')
    plt.ylabel('Cost')
    plt.legend(bbox_to_anchor=(1.05, 1), loc=2, borderaxespad=0.)
    plt.title('learning rate')


# 正规方程
def NormalEquation(matrixX, matrixY):
    matrixTheta = np.linalg.inv(matrixX.T * matrixX) * matrixX.T * matrixY  # Python2.7
    # matrixTheta = np.linalg.inv(matrixX.T @ matrixX) @ matrixX.T @ matrixY  # Python3
    return matrixTheta


# 标准化特征值
def NormalizeFeature(dataFrame):
    return dataFrame.apply(lambda column: (column - column.mean()) / column.std())


def ExerciseOne():
    path = 'ex1data1.txt'
    dataFrame = pd.read_csv(path, header=None, names=['Population', 'Profit'])

    # 补项
    dataFrame.insert(0, 'Ones', 1)
    nColumnCount = dataFrame.shape[1]
    dataFrameX = dataFrame.iloc[:, 0:nColumnCount - 1]
    dataFrameY = dataFrame.iloc[:, nColumnCount - 1:nColumnCount]

    # 初始化数据
    matrixX = np.matrix(dataFrameX.values)
    matrixY = np.matrix(dataFrameY.values)
    matrixOriginTheta = np.matrix(np.zeros(dataFrameX.shape[1]))

    # 设置学习率和迭代次数
    fAlpha = 0.01
    nIterCounts = 1000
    matrixTheta, arrayCost = GradientDescent(matrixX, matrixY, matrixOriginTheta, fAlpha, nIterCounts)

    print matrixTheta
    print NormalEquation(matrixX, matrixY)

    # 设置不同的学习率
    arrayAlpha = [0.000001, 0.00001, 0.0001, 0.001, 0.01]
    dictCost = {}
    for fAlpha in arrayAlpha:
        _, arrayCostTemp = GradientDescent(matrixX, matrixY, matrixOriginTheta, fAlpha, nIterCounts)
        dictCost[fAlpha] = arrayCostTemp

    # 显示不同图表
    plt.figure(figsize=(12, 12))
    ShowLineRegressionResult(dataFrame, matrixTheta)
    ShowCostChange(arrayCost, nIterCounts)
    ShowLearningRateChange(dictCost, nIterCounts)
    plt.show()


ExerciseOne()
# -*- coding: utf-8 -*-
"""
__author__ = 'ljyn4180'
"""

import numpy as np
import pandas as pd
import matplotlib.pyplot as plt
import mpl_toolkits.mplot3d.axes3d as Axes3D


def CostFunction(matrixX, matrixY, matrixTheta):
    Inner = np.power(((matrixX * matrixTheta.T) - matrixY), 2)
    return np.sum(Inner) / (2 * len(matrixX))


def GradientDescent(matrixX, matrixY, matrixTheta, fAlpha, nIterCounts):
    matrixThetaTemp = np.matrix(np.zeros(matrixTheta.shape))
    nParameters = int(matrixTheta.ravel().shape[1])
    arrayCost = np.zeros(nIterCounts)

    for i in xrange(nIterCounts):
        matrixError = (matrixX * matrixTheta.T) - matrixY

        for j in xrange(nParameters):
            matrixSumTerm = np.multiply(matrixError, matrixX[:, j])
            matrixThetaTemp[0, j] = matrixTheta[0, j] - fAlpha / len(matrixX) * np.sum(matrixSumTerm)

        matrixTheta = matrixThetaTemp
        arrayCost[i] = CostFunction(matrixX, matrixY, matrixTheta)

    return matrixTheta, arrayCost


def ShowLineRegressionResult(dataFrame, matrixTheta):
    x = np.array(dataFrame.square)
    y = np.array(dataFrame.bedrooms)
    z = matrixTheta[0, 0] + (matrixTheta[0, 1] * x) + (matrixTheta[0, 2] * y)

    print z

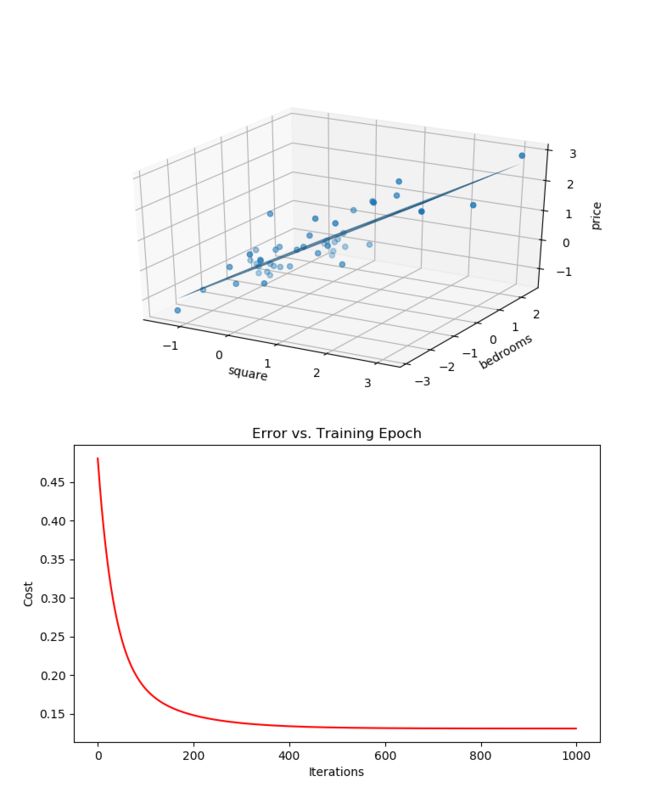
    ax = plt.subplot(211, projection='3d')
    ax.plot_trisurf(x, y, z)
    ax.scatter(dataFrame.square, dataFrame.bedrooms, dataFrame.price, label='Training Data')
    ax.set_xlabel('square')
    ax.set_ylabel('bedrooms')
    ax.set_zlabel('price')
    # plt.title('Predicted Profit vs. Population Size')


def ShowCostChange(arrayCost, nIterCounts):
    plt.subplot(212)
    plt.plot(np.arange(nIterCounts), arrayCost, 'r')
    plt.xlabel('Iterations')
    plt.ylabel('Cost')
    plt.title('Error vs. Training Epoch')


def NormalizeFeature(dataFrame):
    return dataFrame.apply(lambda column: (column - column.mean()) / column.std())


def ExerciseTwo():
    path = 'ex1data2.txt'
    dataFrame = pd.read_csv(path, header=None, names=['square', 'bedrooms', 'price'])

    dataFrame = NormalizeFeature(dataFrame)
    # data['square'] = data['square'] / 1000
    # data['price'] = data['price'] / 100000
    # 补项
    dataFrame.insert(0, 'Ones', 1)
    nColumnCount = dataFrame.shape[1]
    dataFrameX = dataFrame.iloc[:, 0:nColumnCount - 1]
    dataFrameY = dataFrame.iloc[:, nColumnCount - 1:nColumnCount]

    matrixX = np.matrix(dataFrameX.values)
    matrixY = np.matrix(dataFrameY.values)
    matrixTheta = np.matrix(np.zeros(dataFrameX.shape[1]))

    fAlpha = 0.01
    nIterCounts = 1000
    matrixTheta, arrayCost = GradientDescent(matrixX, matrixY, matrixTheta, fAlpha, nIterCounts)

    print matrixTheta

    plt.figure(figsize=(8, 10))
    ShowLineRegressionResult(dataFrame, matrixTheta)
    ShowCostChange(arrayCost, nIterCounts)
    plt.show()

ExerciseTwo()


