python3实现kmeans聚类分析
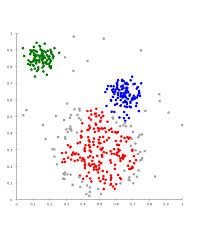
1,聚类(clustering) 属于非监督学习 (unsupervised learning),属于回归问题,比如下图的聚类分析。
2. K-means 算法:
2.1 Clustering 中的经典算法,数据挖掘十大经典算法之一
2.2 算法接受参数 k ;然后将事先输入的n个数据对象划分为 k个聚类以便使得所获得的聚类满足:同一聚类中的对象相似度较高;而不同聚类中的对象相似度较小。
2.3 算法思想:
以空间中k个点为中心进行聚类,对最靠近他们的对象归类。通过迭代的方法,逐次更新各聚类中心 的值,直至得到最好的聚类结果
2.4 算法描述:
(1)适当选择c个类的初始中心;
(2)在第k次迭代中,对任意一个样本,求其到c各中心的距离,将该样本归到距离最短的中心所在的类;
(3)利用均值等方法更新该类的中心值;
(4)对于所有的c个聚类中心,如果利用(2)(3)的迭代法更新后,值保持不变,则迭代结束,否则继续迭代。
3,算法描述:
输入:k, data[n];
(1) 选择k个初始中心点,例如c[0]=data[0],…c[k-1]=data[k-1];
(2) 对于data[0]….data[n], 分别与c[0]…c[k-1]比较,假定与c[i]差值最少,就标记为i;
(3) 对于所有标记为i点,重新计算c[i]={ 所有标记为i的data[j]之和}/标记为i的个数;
(4) 重复(2)(3),直到所有c[i]值的变化小于给定阈值。
4,举例分析:
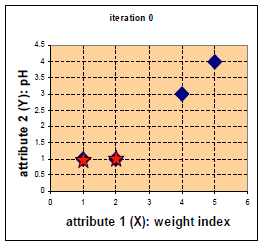
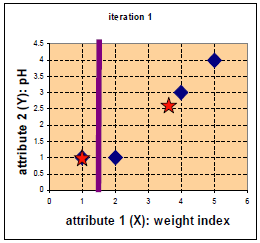
比如有a(1,1),b(2,1),c(4,3),d(5,4),我们首先选择a和b作为中心点。
求距离:A(x1,y1),B(x2,y2)的距离是:dist =sqrt((x2-x1)^2+(y2-y1)^2)),所以我们首先选择a(1,1),b(2,1)作为中心点,从而计算a,b分别到a,b,c,d的距离,于是距离计算如下:
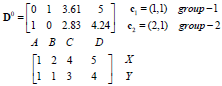
对数据进行分类,也就是数据大的作为0,数据小的作为1,我们更新分类如下:
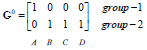
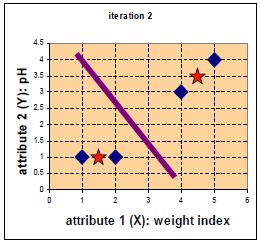
我们来重新更新中心点,第一类是a,均值是(1,1),对于b,c,d三点计算平均值:
![]()
重新计算a,b,c,d到(1,1)和(11/3,8/3)距离如下:
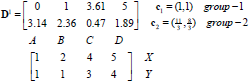
更新数据分类如下:![]()
所以现在数据分作两类,我们重新计算平均值和距离:
![]()
再次更新平均值和距离:
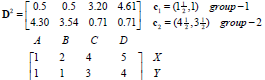
![]()
分类和前次一样,所以分类截至了。
5,spyder建立python代码(k_means.py):
import numpy as np

# Function: K Means
# -------------
# K-Means is an algorithm that takes in a dataset and a constant
# k and returns k centroids (which define clusters of data in the
# dataset which are similar to one another).
def kmeans(X, k, maxIt):

    numPoints, numDim = X.shape

    dataSet = np.zeros((numPoints, numDim + 1))
    dataSet[:, :-1] = X

    # Initialize centroids randomly
    centroids = dataSet[np.random.randint(numPoints, size = k), :]
    centroids = dataSet[0:2, :]
    #Randomly assign labels to initial centorid
    centroids[:, -1] = range(1, k +1)

    # Initialize book keeping vars.
    iterations = 0
    oldCentroids = None

    # Run the main k-means algorithm
    while not shouldStop(oldCentroids, centroids, iterations, maxIt):
        print "iteration: \n", iterations
        print "dataSet: \n", dataSet
        print "centroids: \n", centroids
        # Save old centroids for convergence test. Book keeping.
        oldCentroids = np.copy(centroids)
        iterations += 1

        # Assign labels to each datapoint based on centroids
        updateLabels(dataSet, centroids)

        # Assign centroids based on datapoint labels
        centroids = getCentroids(dataSet, k)

    # We can get the labels too by calling getLabels(dataSet, centroids)
    return dataSet
# Function: Should Stop
# -------------
# Returns True or False if k-means is done. K-means terminates either
# because it has run a maximum number of iterations OR the centroids
# stop changing.
def shouldStop(oldCentroids, centroids, iterations, maxIt):
    if iterations > maxIt:
        return True
    return np.array_equal(oldCentroids, centroids)
# Function: Get Labels
# -------------
# Update a label for each piece of data in the dataset.
def updateLabels(dataSet, centroids):
    # For each element in the dataset, chose the closest centroid.
    # Make that centroid the element's label.
    numPoints, numDim = dataSet.shape
    for i in range(0, numPoints):
        dataSet[i, -1] = getLabelFromClosestCentroid(dataSet[i, :-1], centroids)


def getLabelFromClosestCentroid(dataSetRow, centroids):
    label = centroids[0, -1];
    minDist = np.linalg.norm(dataSetRow - centroids[0, :-1])
    for i in range(1 , centroids.shape[0]):
        dist = np.linalg.norm(dataSetRow - centroids[i, :-1])
        if dist < minDist:
            minDist = dist
            label = centroids[i, -1]
    print "minDist:", minDist
    return label


# Function: Get Centroids
# -------------
# Returns k random centroids, each of dimension n.
def getCentroids(dataSet, k):
    # Each centroid is the geometric mean of the points that
    # have that centroid's label. Important: If a centroid is empty (no points have
    # that centroid's label) you should randomly re-initialize it.
    result = np.zeros((k, dataSet.shape[1]))
    for i in range(1, k + 1):
        oneCluster = dataSet[dataSet[:, -1] == i, :-1]
        result[i - 1, :-1] = np.mean(oneCluster, axis = 0)
        result[i - 1, -1] = i

    return result


x1 = np.array([1, 1])
x2 = np.array([2, 1])
x3 = np.array([4, 3])
x4 = np.array([5, 4])
testX = np.vstack((x1, x2, x3, x4))

result = kmeans(testX, 2, 10)
print "final result:"
print result
结果打印如下:
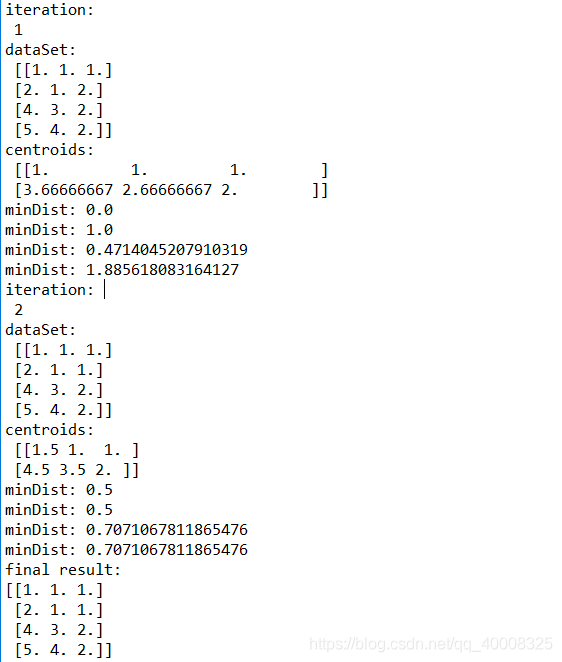
通过对比,可以看到结果和手工计算一致。