Anaconda+Tushare安装运行宝笈
金融数据库Tushare是基于Python开发的。Anaconda是最适合在windows上安装的python集成使用环境。
话不多说,先下载 anaconda2,
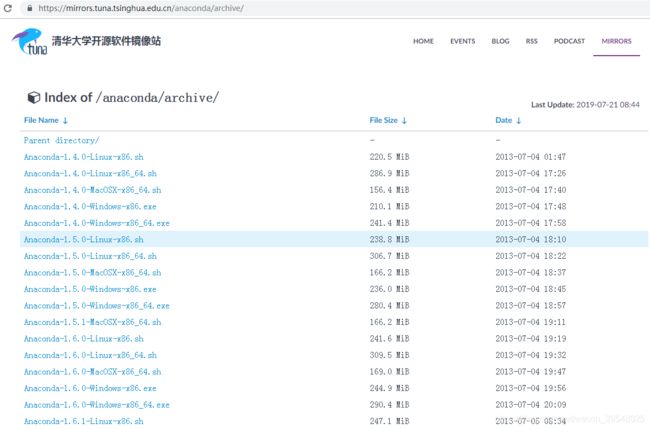
可以从清华的镜像库下载 https://mirrors.tuna.tsinghua.edu.cn/anaconda/archive/ , anaconda2对应python 2X版本,anaconda3对应python 3X版本,我下载安装了 Anaconda2-5.3.0-Windows-x86_64.exe
启动anaconda命令窗口:
开始> 所有程序> anaconda> anaconda prompt
会得到两行提示:
Deactivating environment "d:\Anaconda2"...
Activating environment "d:\Anaconda2"...
安装tushare包
- 在anaconda 命令窗口里: 输入 pip install tushare
- 安装提示信息为:
[Anaconda2] C:\Documents and Settings\Administrator>pip install tushare
Collecting tushare
Downloading tushare-0.5.0.zip (89kB)
45% |██████████████▊ | 40kB 292kB/s eta 0:00:
57% |██████████████████▍ | 51kB 328kB/s eta 0
68% |██████████████████████ | 61kB 393kB/s et
80% |█████████████████████████▊ | 71kB 328kB/
91% |█████████████████████████████▍ | 81kB 35
100% |████████████████████████████████| 92kB
280kB/s
Building wheels for collected packages: tushare
Running setup.py bdist_wheel for tushare ... done
Stored in directory: C:\Documents and Settings\Administrator\Local Settings\Application Data\pip\Cache\wheels\2c\55\89\d4a3052f45104e809b0fd3a546ba6eff89ded4446dcfb0c9a1
Successfully built tushare
Installing collected packages: tushare
Successfully installed tushare-0.5.0
You are using pip version 8.1.1, however version 8.1.2 is available.
You should consider upgrading via the 'python -m pip install --upgrade pip' command.
打开spyder窗口,输入下列测试代码
# -*- coding: utf-8 -*-
import tushare as ts
print (ts.__version__)
df=ts.get_profit_data(2017,2)
df=ts.get_stock_basics()
print df
执行代码以后,结果如下
1.2.37
[Getting data:]#############################################################
code name industry area pe ... profit gpr npr holders
603256 N宏和 玻璃 上海 46.16 ... 0.00 36.86 18.61 83152.0
300179 四方达 矿物制品 河南 27.86 ... 47.34 56.29 20.76 29143.0
002201 九鼎新材 玻璃 江苏 263.97 ... 5.67 23.76 1.12 16600.0
000011 深物业A 区域地产 深圳 20.19 ... 46.72 48.85 20.32 44082.0
002639 雪人股份 专用机械 福建 628.47 ... 14.66 25.35 0.79 58791.0
600281 太化股份 综合类 山西 0.00 ... 28.09 4.33 -9.17 26215.0
成功了,接下去我们还可以
使用matplotlib画出各类证券数据图表
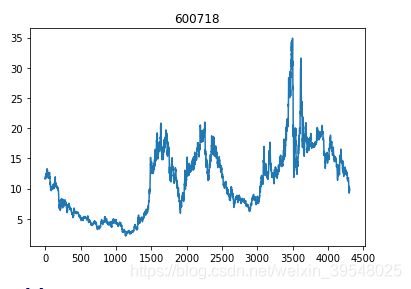
下列python程序获取东软集团(600718)股票新世纪以来的K线交易数据,然后绘制成类K线图表。
import tushare as ts

a = ts.get_k_data('600718',start='2000-10-01')
list1=[]

for i in range(a.index[0],len(a.index)):
    list1.append(a['open'][i])

import matplotlib.pyplot as plt
from matplotlib.ticker import FuncFormatter, MaxNLocator

fig = plt.figure()
ax = fig.add_subplot(111)
xs = len(a.index)
ys_open = list1

ax.xaxis.set_major_locator(MaxNLocator(integer=True))
ax.plot( ys_open)

plt.title("600718")
plt.show()
运行以后绘制的图表如下:

