K-近邻算法分类与回归
k-近邻算法(KNN)
KNN一种可以用于分类和回归任务的算法,KNN隐藏着强大的功能和高可用性,该方法的思路是:如果一个样本在特征空间中的k个最相似(即特征空间中最邻近)的样本中的大多数属于某一个类别,则该样本也属于这个类别。
k-近邻模型
度量空间是定义了集合中所有成员之间距离的特征空间。超参k用来指定估计过程应该包含多少个邻居。超参是用来控制算法如何学习的参数,它不通过训练数据来估计,一般需要人为指定,最后通过某种距离函数,从度量空间选出k个距离测试实例最近邻居。
二元分类
#In[1]
import numpy as np
import matplotlib.pyplot as plt
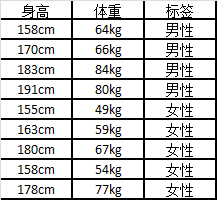
X_train=np.array([
[158,64],
[170,86],
[183,84],
[191,80],
[155,49],
[163,59],
[180,67],
[158,54],
[170,67]
])
y_train=['male','male','male','male','female','female','female','female','female']
plt.figure()
plt.title('Human Heights and Weights by Sex')
plt.xlabel('Height in cm')
plt.ylabel('Weight in kg')
for i,x in enumerate(X_train):
#使用'x'标记训练实例中的男性,使用菱形标记表示训练实例中的女性
plt.scatter(x[0],x[1],c='k',marker='x' if y_train[i]=='male' else 'D')
plt.grid(True)
plt.show()
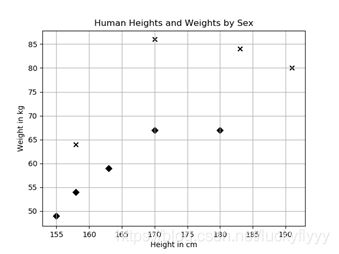
将表格中的数据,通过PYTHON进行如上处理,得到out[1]的散点图,其中x代表男性,菱形代表女性,由此可见男性的整体趋势比女性更高更重,假设预测对象身高155cm,体重70kg,用KNN预测其标签(性别),首先定义距离衡量方法,p,q两点间的距离
d(p,q)=d(q,p)=√[(x1-x2)∧2+(y1-y2)∧2]
接下来,如表二所示,计算测试实例和所有训练实例之间的距离

设置参数3,并选取3个距离最近的训练实例
#in[2]
x=np.array([[155,70]])
distances=np.sqrt(np.sum((X_train-x)**2,axis=1))
print(distances)
#out[2]
array([ 6.70820393, 21.9317122 , 31.30495168, 37.36308338, 21.        ,
       13.60147051, 25.17935662, 16.2788206 , 15.29705854])
#in[3]
nearest_neighbor_indices=distances.argsort()[:3]
nearest_neighbor_genders=np.take(y_train,nearest_neighbor_indices)
nearest_neighbor_genders
#out[3]
array(['male', 'female', 'female'], dtype='
#in[4]
from collections import Counter
b=Counter(np.take(y_train,distances.argsort()[:3]))
b.most_common(1)[0][0]
#out[4]
'female'
#in[5]
#对测试集与k邻近结果进行显示
import numpy as np
import matplotlib.pyplot as plt
X_train=np.array([
    [158,64],
    [170,86],
    [183,84],
    [191,80],
    [155,49],
    [163,59],
    [180,67],
    [158,54],
    [170,67]
])
y_train=['male','male','male','male','female','female','female','female','female']
x=np.array([[155,70]])
distances=np.sqrt(np.sum((X_train-x)**2,axis=1))
nearest_neighbor_indices=distances.argsort()[:3]
B=nearest_neighbor_indices
plt.figure()
plt.title('Human Heights and Weights by Sex')
plt.xlabel('Height in cm')
plt.ylabel('Weight in kg')
for i,x in enumerate(x):
    plt.scatter(x[0],x[1],c='k',s=500,marker='o' )
for i,x in enumerate(X_train):
#使用'x'标记训练实例中的男性,使用菱形标记表示训练实例中的女性
    for j,b in enumerate(B):
      if i==b:
          plt.scatter(x[0],x[1],c='k',s=500,marker='x' if y_train[i]=='male' else 'D')
    plt.scatter(x[0],x[1],c='k',marker='x' if y_train[i]=='male' else 'D')
plt.grid(True)
plt.show()
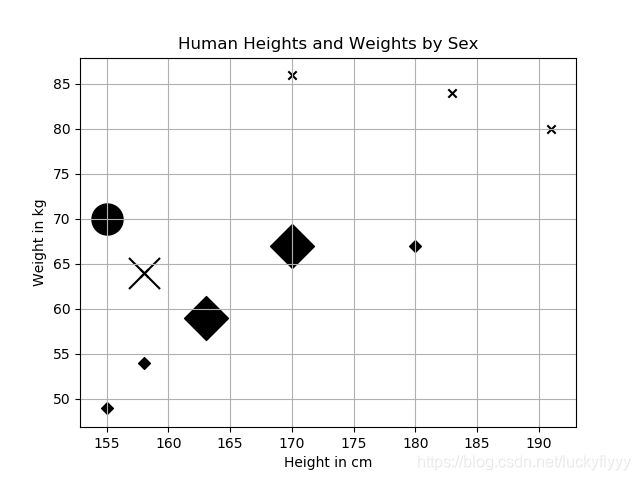
由上图可见,两个邻居为女性样本,一个为男性样本,因此推测测试实例为女性
参考书籍 《scikit-learn机器学习》