2019年美赛C题画图,python函数库basemap下载
第一次接触建模,就碰到要画美国的地图(2019年美赛C题),实在是头疼。解决的函数找到了,结果第三方库无法下载,虽然知道可以通过.whl直接下载,但有100多M下载时间实在太长,分享一个下载包括所有的第三方库。
下面的函数是别人写的,最近打开的网页太多,原作者找不到了。
from __future__ import (absolute_import, division, print_function)

import numpy as np
import matplotlib.pyplot as plt
from mpl_toolkits.basemap import Basemap
from matplotlib.colors import rgb2hex, Normalize
from matplotlib.patches import Polygon
from matplotlib.colorbar import ColorbarBase

fig, ax = plt.subplots()

# Read the geographic graph of the United States
m = Basemap(llcrnrlon=-119, llcrnrlat=20, urcrnrlon=-64, urcrnrlat=49,
            projection='lcc', lat_1=33, lat_2=45, lon_0=-95)

m_ = Basemap(llcrnrlon=-190, llcrnrlat=20, urcrnrlon=-143, urcrnrlat=46,
             projection='merc', lat_ts=20)  # do not change these numbers

# Graphics are obtained from state-provided graphics
shp_info = m.readshapefile('st99_d00', 'states', drawbounds=True,
                           linewidth=0.45, color='gray')
shp_info_ = m_.readshapefile('st99_d00', 'states', drawbounds=False)

# The United States
popdensity = {

    'New Jersey': 1,
    'Rhode Island': 1,
    'Massachusetts': 1,
    'Connecticut': 1,
    'Maryland': 1,
    'New York': 1,
    'Delaware': 1,
    'Florida': 1,
    'Ohio': 1193.49,
    'Pennsylvania': 687.51,
    'Illinois': 1,
    'California': 1,
    'Hawaii': 1,
    'Virginia': 369.94,
    'Michigan': 1,
    'Indiana': 1,
    'North Carolina': 1,
    'Georgia': 1,
    'Tennessee': 1,
    'New Hampshire': 1,
    'South Carolina': 1,
    'Louisiana': 1,
    'Kentucky': 288.70,
    'Wisconsin': 1,
    'Washington': 1,
    'Alabama': 1,
    'Missouri': 1,
    'Texas': 1,
    'West Virginia': 36.72,
    'Vermont': 1,
    'Minnesota': 1,
    'Mississippi': 1,
    'Iowa': 1,
    'Arkansas': 1,
    'Oklahoma': 1,
    'Arizona': 1,
    'Colorado': 1,
    'Maine': 1,
    'Oregon': 1,
    'Kansas': 1,
    'Utah': 1,
    'Nebraska': 1,
    'Nevada': 1,
    'Idaho': 1,
    'New Mexico': 1,
    'South Dakota': 1,
    'North Dakota': 1,
    'Montana': 1,
    'Wyoming': 1,
    'Alaska': 1, }

colors = {
     }
statenames = []
cmap = plt.cm.hot_r
vmin = 0
vmax = 1200
norm = Normalize(vmin=vmin, vmax=vmax)

# Read the data
for shapedict in m.states_info:
    statename = shapedict['NAME']
    if statename not in ['District of Columbia', 'Puerto Rico']:
        pop = popdensity[statename]
        colors[statename] = cmap(np.sqrt((pop - vmin) / (vmax - vmin)))[:3]
    statenames.append(statename)
for nshape, seg in enumerate(m.states):
    if statenames[nshape] not in ['Puerto Rico', 'District of Columbia']:
        color = rgb2hex(colors[statenames[nshape]])
        poly = Polygon(seg, facecolor=color, edgecolor=color)
        ax.add_patch(poly)

AREA_1 = 0.005
AREA_2 = AREA_1 * 30.0
AK_SCALE = 0.19
HI_OFFSET_X = -1900000
HI_OFFSET_Y = 250000
AK_OFFSET_X = -250000
AK_OFFSET_Y = -750000

for nshape, shapedict in enumerate(m_.states_info):
    if shapedict['NAME'] in ['Alaska', 'Hawaii']:
        seg = m_.states[int(shapedict['SHAPENUM'] - 1)]
        if shapedict['NAME'] == 'Hawaii' and float(shapedict['AREA']) > AREA_1:
            seg = [(x + HI_OFFSET_X, y + HI_OFFSET_Y) for x, y in seg]
            color = rgb2hex(colors[statenames[nshape]])
        elif shapedict['NAME'] == 'Alaska' and float(shapedict['AREA']) > AREA_2:
            seg = [(x * AK_SCALE + AK_OFFSET_X, y * AK_SCALE + AK_OFFSET_Y) \
                   for x, y in seg]
            color = rgb2hex(colors[statenames[nshape]])
        poly = Polygon(seg, facecolor=color, edgecolor='gray', linewidth=.45)
        ax.add_patch(poly)

light_gray = [0.8] * 3  # define light gray color RGB
x1, y1 = m_([-190, -183, -180, -180, -175, -171, -171], [29, 29, 26, 26, 26, 22, 20])
x2, y2 = m_([-180, -180, -177], [26, 23, 20])  # these numbers are fine-tuned manually
m_.plot(x1, y1, color=light_gray, linewidth=0.8)  # do not change them drastically
m_.plot(x2, y2, color=light_gray, linewidth=0.8)

ax_c = fig.add_axes([0.9, 0.1, 0.03, 0.8])
cb = ColorbarBase(ax_c, cmap=cmap, norm=norm, orientation='vertical',
                  label=r'[population per $\mathregular{km^2}$]')
plt.show()
因为需要美国的轮廓图,下面的三个文件必须要:

链接:https://pan.baidu.com/s/1BO2CRJhDjTzoNOsK8BF8kQ
提取码:xrw7
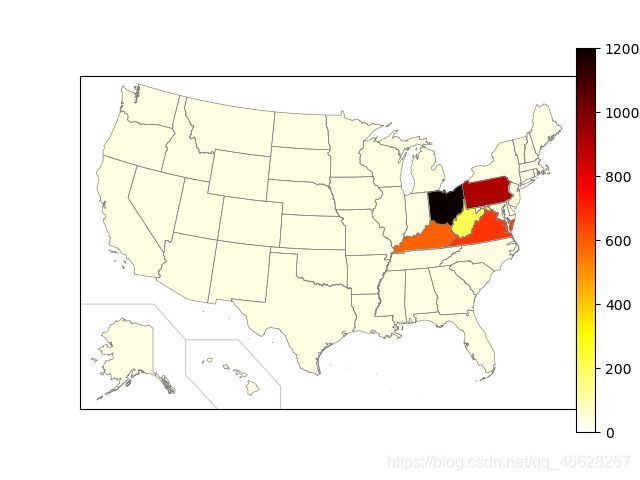
效果图: