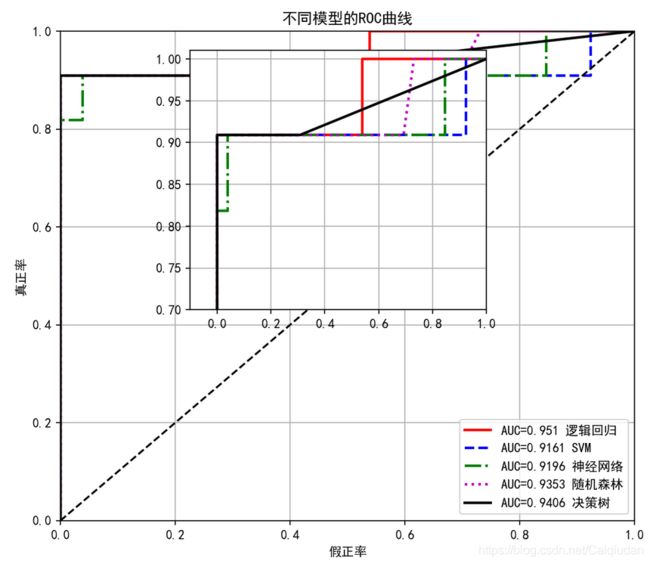
lable_names = ["逻辑回归","SVM","神经网络","随机森林","决策树"]
colors = ["r","b","g","m","k",]
linestyles =["-", "--", "-.", ":", "-"]
fig = plt.figure(figsize=(8,7),dpi=150)
for n in range(5):
plt.plot(fpr[n], tpr[n],color=colors[n],linewidth = 2,
linestyle = linestyles[n],
label = f'AUC={auc[n]} '+lable_names[n])
plt.plot([0, 1], [0, 1], 'k--')
plt.xlabel("假正率"); plt.ylabel("真正率")
plt.xlim(0, 1); plt.ylim(0, 1)
plt.grid()
plt.legend()
plt.title("不同模型的ROC曲线")
inset_ax = fig.add_axes([0.3, 0.45, 0.4, 0.4],facecolor="white")
for n in range(5):
inset_ax.plot(fpr[n], tpr[n],color=colors[n],linewidth = 2,linestyle = linestyles[n],
label = f'AUC={auc[n]} '+lable_names[n])
inset_ax.set_xlim([-0.1,1])
inset_ax.set_ylim([0.7,1.01])
inset_ax.grid()
plt.show()

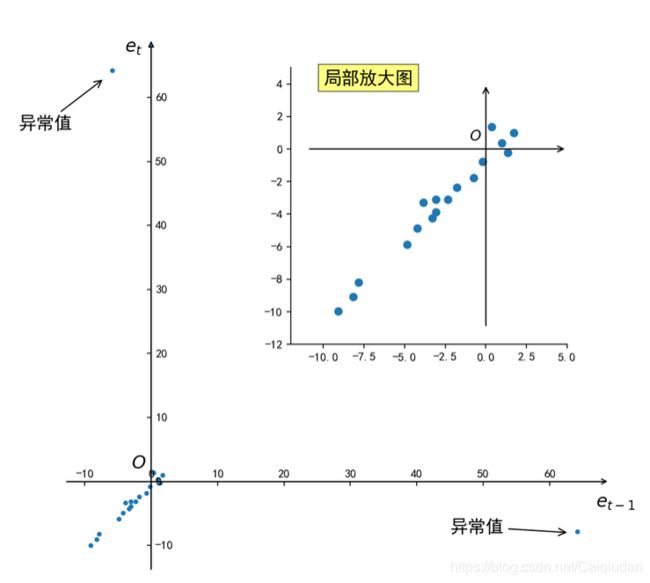
def e_picture_auto(self):
fig = plt.figure(figsize=(8, 8))
ax = axisartist.Subplot(fig, 111)
fig.add_axes(ax)
ax.axis[:].set_visible(False)
ax.axis["x"] = ax.new_floating_axis(0,0)
ax.axis["x"].set_axisline_style("->", size = 1.0)
ax.axis["y"] = ax.new_floating_axis(1,0)
ax.axis["y"].set_axisline_style("-|>", size = 1.0)
ax.axis["x"].set_axis_direction("top")
ax.axis["y"].set_axis_direction("right")
plt.scatter(self.e.values[:-1],self.e.values[1:], marker='.')
plt.annotate("异常值", (-7,63), xycoords='data',xytext=(-20, 55),arrowprops=dict(arrowstyle='->'),fontsize=15)
plt.annotate("异常值", (63,-8), xycoords='data',xytext=(45, -8),arrowprops=dict(arrowstyle='->'),fontsize=15)
plt.annotate(r"$e_t$", (-3,67), xycoords='data',xytext=(-4,67),fontsize=15)
plt.annotate(r"$e_{t-1}$", (67,5), xycoords='data',xytext=(67,-4),fontsize=15)
plt.annotate(r"$O$", (67,5), xycoords='data',xytext=(-3,2),fontsize=15)
inset_ax = fig.add_axes([0.45, 0.45, 0.4, 0.4],facecolor="white")
inset_ax.scatter(self.e.values[:-1],self.e.values[1:])
inset_ax.set_xlim([-12,5])
inset_ax.set_ylim([-12,5])
inset_ax.annotate("", (-11,0), xycoords='data',arrowprops=dict(arrowstyle='<-'),xytext=(5,0),fontsize=12)
inset_ax.annotate("", (0,-11), xycoords='data',arrowprops=dict(arrowstyle='<-'),xytext=(0,4),fontsize=12)
inset_ax.annotate(r"$O$", (-1,0.5), xycoords='data',xytext=(-1,0.5),fontsize=12)
inset_ax.spines['right'].set_visible(False)
inset_ax.spines['top'].set_visible(False)
inset_ax.text(-10,4, '局部放大图', bbox=dict(facecolor='yellow', alpha=0.5), fontsize=15)


