JQData | 基于JQData的有效前沿及投资组合优化
基于JQData的有效前沿组合及投资组合优化
转自 https://www.joinquant.com/community/post/detailMobile?postId=15331&page=&limit=20&replyId=&tag=
(1)现代资产组合理论(MTP)是关于在特定风险水平下投资者(风险厌恶)如何构建组合来最大化期望收益的理论,这一理论最基本的原则是投资者可以构建投资组合的有效集合,即有效前沿,有效前沿可以在特定风险水平下使期望收益最大化;
(2)资产的风险一般使用资产回报的波动方差来表示,在回报和风险相权衡的时候,根据资本资产定价模型(CAPM)一般使用夏普率来评估风险回报比,来衡量特定风险下投资收益的表现,希望在尽可能小的风险下获得最大的回报;
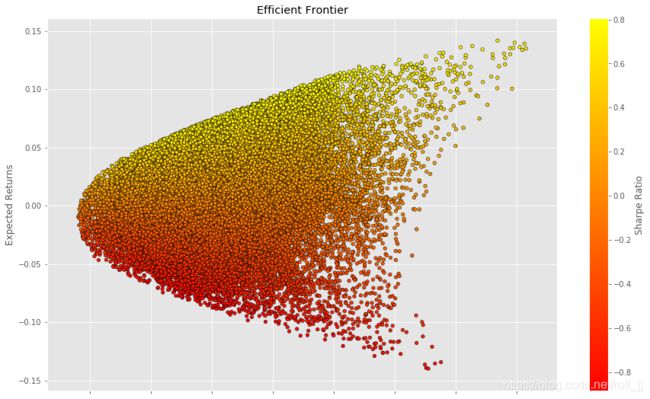
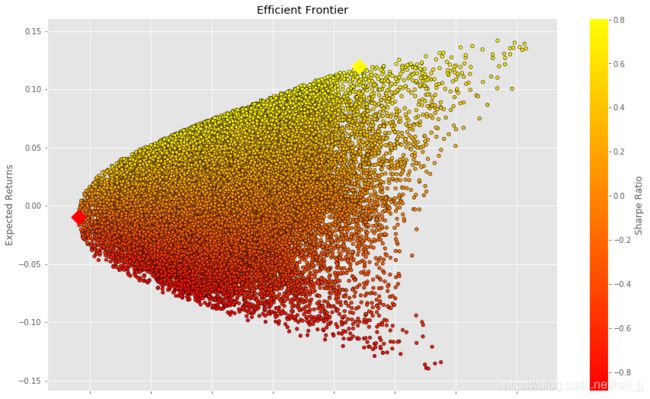
(3)下面介绍通过JQData及Monte Carlo模拟来建立有效前沿组合,然后找出最优组合和有着最低波动率的组合。
1 通过JQData获取数据
# 导入所需的python库
import jqdatasdk as jq
import pandas as pd
import numpy as np
import matplotlib.pyplot as plt

# JQData认证
jq.auth('注册手机号', '密码')

# 设置起止时间及股票池
start_date = '2018-01-01'
end_date = '2018-11-16'
security_list = ['513100.XSHG', '518800.XSHG', '163407.XSHE', '159926.XSHE']

# 获取数据
stocks_price = jq.get_price(security_list, start_date=start_date, end_date=end_date, fields=['close'])['close']
stocks_price.head()
auth success
.dataframe tbody tr th:only-of-type { vertical-align: middle; } .dataframe tbody tr th { vertical-align: top; } .dataframe thead th { text-align: right; }
| 513100.XSHG | 518800.XSHG | 163407.XSHE | 159926.XSHE | |
|---|---|---|---|---|
| 2018-01-02 | 2.218 | 2.730 | 1.889 | 105.0 |
| 2018-01-03 | 2.248 | 2.735 | 1.915 | 105.0 |
| 2018-01-04 | 2.256 | 2.729 | 1.904 | 105.0 |
| 2018-01-05 | 2.250 | 2.740 | 1.892 | 105.0 |
| 2018-01-08 | 2.268 | 2.740 | 1.881 | 105.0 |
2 通过Monte Carlo模拟产生有效前沿组合,并找出最优组合和有着最低波动率的组合
通过Monte Carlo模拟50000个不同权重的投资组合产生的不同期望收益和期望波动率并绘图。有效前沿上的每个点代表了股票的一个最优组合,最优组合在特定的风险水平下最大化了期望收益率。
# 通过Monte Carlo模拟产生有效前沿组合

returns_daily = stocks_price.pct_change()
returns_annual = returns_daily.mean() * 250

cov_daily = returns_daily.cov()
cov_annual = cov_daily * 250

port_returns = []
port_volatility = []
sharpe_ratio = []
stock_weights = []

num_assets = len(security_list)
num_portfolios = 50000

np.random.seed(101)

for single_portfolio in range(num_portfolios):
   weights = np.random.random(num_assets)
   weights /= np.sum(weights)
   returns = np.dot(weights, returns_annual)
   volatility = np.sqrt(np.dot(weights.T, np.dot(cov_annual, weights)))
   sharpe = returns / volatility
   sharpe_ratio.append(sharpe)
   port_returns.append(returns)
   port_volatility.append(volatility)
   stock_weights.append(weights)

portfolio = {'Returns': port_returns,
            'Volatility': port_volatility,
            'Sharpe Ratio': sharpe_ratio}

for counter,symbol in enumerate(security_list):
   portfolio[symbol+' Weight'] = [Weight[counter] for Weight in stock_weights]

df = pd.DataFrame(portfolio)
column_order = ['Returns', 'Volatility', 'Sharpe Ratio'] + [stock+' Weight' for stock in security_list]
df = df[column_order]
df.head()
.dataframe tbody tr th:only-of-type { vertical-align: middle; } .dataframe tbody tr th { vertical-align: top; } .dataframe thead th { text-align: right; }
| Returns | Volatility | Sharpe Ratio | 513100.XSHG Weight | 518800.XSHG Weight | 163407.XSHE Weight | 159926.XSHE Weight | |
|---|---|---|---|---|---|---|---|
| 0 | 0.059716 | 0.092775 | 0.643661 | 0.401223 | 0.443388 | 0.022123 | 0.133266 |
| 1 | 0.038346 | 0.088553 | 0.433024 | 0.251963 | 0.306608 | 0.112865 | 0.328564 |
| 2 | 0.024950 | 0.121362 | 0.205584 | 0.396923 | 0.104486 | 0.304882 | 0.193709 |
| 3 | -0.055661 | 0.092769 | -0.600004 | 0.084002 | 0.362809 | 0.445883 | 0.107306 |
| 4 | -0.054688 | 0.089040 | -0.614192 | 0.049376 | 0.356635 | 0.430760 | 0.163229 |
# 将投资组合绘制出来

plt.style.use('ggplot')
df.plot.scatter(x='Volatility', y='Returns', c='Sharpe Ratio',
               cmap='autumn', edgecolors='black', figsize=(15, 9), grid=True)
plt.xlabel('Volatility (Std. Deviation)')
plt.ylabel('Expected Returns')
plt.title('Efficient Frontier')
plt.show()
# 找出最优组合和有着最低波动率的组合

min_volatility = df['Volatility'].min()
max_sharpe = df['Sharpe Ratio'].max()

sharpe_portfolio = df.loc[df['Sharpe Ratio'] == max_sharpe]
min_variance_port = df.loc[df['Volatility'] == min_volatility]

plt.style.use('ggplot')
df.plot.scatter(x='Volatility', y='Returns', c='Sharpe Ratio',
               cmap='autumn', edgecolors='black', figsize=(15, 9), grid=True)
plt.scatter(x=sharpe_portfolio['Volatility'], y=sharpe_portfolio['Returns'], c='yellow', marker='D', s=200)
plt.scatter(x=min_variance_port['Volatility'], y=min_variance_port['Returns'], c='red', marker='D', s=200 )
plt.xlabel('Volatility (Std. Deviation)')
plt.ylabel('Expected Returns')
plt.title('Efficient Frontier')
plt.show()
# 接下来输出这两个特殊组合的具体信息:

pd.concat([min_variance_port.T, sharpe_portfolio.T], axis=1)
.dataframe tbody tr th:only-of-type { vertical-align: middle; } .dataframe tbody tr th { vertical-align: top; } .dataframe thead th { text-align: right; }
| 1195 | 17048 | |
|---|---|---|
| Returns | -0.009542 | 0.119439 |
| Volatility | 0.056354 | 0.148343 |
| Sharpe Ratio | -0.169316 | 0.805155 |
| 513100.XSHG Weight | 0.082041 | 0.616620 |
| 518800.XSHG Weight | 0.763013 | 0.014128 |
| 163407.XSHE Weight | 0.086762 | 0.002443 |
| 159926.XSHE Weight | 0.068184 | 0.366809 |
结果说明:
(1)风险厌恶最严重的投资者将会选择最小方差组合,它的期望收益率是-0.95%,期望波动率是5.63%;
(2)追求最大风险调整收益率的投资者将会构建有着最大夏普比率的投资组合,它的期望收益率是11.94%,期望波动率是14.83%。
3 结论
本文使用JQData获取股票数据,参考一系列的文章,通过Monte Carlo模拟产生有效前沿组合,并找出最优组合和有着最低波动率的组合。感谢,参考链接如下。
4 参考链接
JQData的教程及API
JQData的安装方法
CAPM 模型和公式
均值方差模型在投资组合中的简单应用
基于Markowitz的量化投资策略
Markowitz有效边界和投资组合优化基于Python

