logistic回归_R语言实现logistic回归
引言:前面我们已经掌握了logistic回归的知识点,今天就来看看如何用R语言实现logistic回归。今天用到的数据来源于机器学习仓库,基于患者的一些信息以判定该患者是否患有心脏病(heart disease, hd),链接如下:http://archive.ics.uci.edu/ml/datasets/Heart+Disease
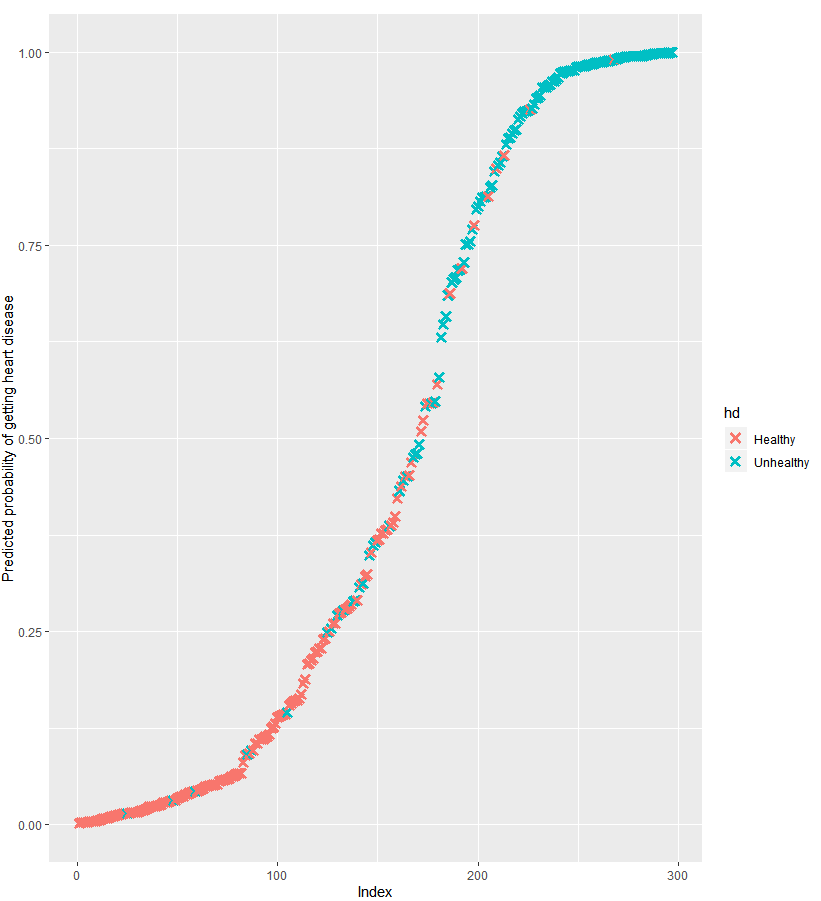
 基于较复杂的模型,得出一个连续型的模型。总体而言,该模型能够将绝大部分的患者判定为患者,其对应的患病的p值>0.5;绝大部分的非患者被判定为非患者,其对应患病的p值<0.5。 参考视频:https://www.youtube.com/watch?v=C4N3_XJJ-jU
1. 数据读取
### 1 读取UCI机器学习中的数据
url "http://archive.ics.uci.edu/ml/machine-learning-databases/heart-disease/processed.cleveland.data"
data FALSE)

# 查看数据
head(data) # 该数据不含有列名,我们很难知道每列代表的意义
#      V1 V2 V3  V4  V5 V6 V7  V8 V9 V10 V11 V12 V13 V14
#    1 63  1  1 145 233  1  2 150  0 2.3   3 0.0 6.0   0
#    2 67  1  4 160 286  0  2 108  1 1.5   2 3.0 3.0   2
#    3 67  1  4 120 229  0  2 129  1 2.6   2 2.0 7.0   1
#    4 37  1  3 130 250  0  0 187  0 3.5   3 0.0 3.0   0
#    5 41  0  2 130 204  0  2 172  0 1.4   1 0.0 3.0   0
#    6 56  1  2 120 236  0  0 178  0 0.8   1 0.0 3.0   0

# 根据机器学习仓库中的数据注释添加列名,便于解读数据的意义
colnames(data)   "age",
  "sex",# 0 = female, 1 = male
  "cp", # chest pain
  # 1 = typical angina,
  # 2 = atypical angina,
  # 3 = non-anginal pain,
  # 4 = asymptomatic
  "trestbps", # resting blood pressure (in mm Hg)
  "chol", # serum cholestoral in mg/dl
  "fbs",  # fasting blood sugar if less than 120 mg/dl, 1 = TRUE, 0 = FALSE
  "restecg", # resting electrocardiographic results
  # 1 = normal
  # 2 = having ST-T wave abnormality
  # 3 = showing probable or definite left ventricular hypertrophy
  "thalach", # maximum heart rate achieved
  "exang",   # exercise induced angina, 1 = yes, 0 = no
  "oldpeak", # ST depression induced by exercise relative to rest
  "slope", # the slope of the peak exercise ST segment
  # 1 = upsloping
  # 2 = flat
  # 3 = downsloping
  "ca", # number of major vessels (0-3) colored by fluoroscopy
  "thal", # this is short of thalium heart scan
  # 3 = normal (no cold spots)
  # 6 = fixed defect (cold spots during rest and exercise)
  # 7 = reversible defect (when cold spots only appear during exercise)
  "hd" # (the predicted attribute) - diagnosis of heart disease  心脏病的诊断属性
  # 0 if less than or equal to 50% diameter narrowing
  # 1 if greater than 50% diameter narrowing
)

### 查看增加列名后的数据
head(data)
#   age sex cp trestbps chol fbs restecg thalach exang oldpeak slope  ca thal hd
# 1  63   1  1      145  233   1       2     150     0     2.3     3 0.0  6.0  0
# 2  67   1  4      160  286   0       2     108     1     1.5     2 3.0  3.0  2
# 3  67   1  4      120  229   0       2     129     1     2.6     2 2.0  7.0  1

### 查看数据的整体情况
# 'data.frame': 303 obs. of  14 variables:
#   $ age     : num  63 67 67 37 41 56 62 57 63 53 ...  #年龄数值变量
#   $ sex     : num  1 1 1 1 0 1 0 0 1 1 ...  #性别,数值型变量(应改为因子型变量)
#   $ cp      : num  1 4 4 3 2 2 4 4 4 4 ... #胸痛情况(应改为因子型变量)
#   $ trestbps: num  145 160 120 130 130 120 140 120 130 140 ...
#   $ chol    : num  233 286 229 250 204 236 268 354 254 203 ...
#   $ fbs     : num  1 0 0 0 0 0 0 0 0 1 ... #空腹血糖是否满足小于120 mg/dl(应改为因子型变量)
#   ......
#   ......
2. 数据预处理(确保数据能够在程序中被正常识别)
数据类型的整理:将分类变量设置为factor,连续型变量为num保持不变,删除缺失值记录。
### 2 数据预处理
# str(data) 查看数据的整体情况,判断哪些变量需要进行类型转换

## "?"为字符型数据,将"?"转换为NA
data[data == "?"] NA

## 将分类变量设置为factor,连续型变量为num保持不变
#  这一步是确保数据能够在程序中被正确识别
data[data$sex == 0,]$sex "F"
data[data$sex == 1,]$sex "M"
data$sex
data$cp data$fbs data$restecg data$exang data$slope

data$ca #R将"?"认为是字符型,故需要修正为整数型
data$ca #将整数型改为因子型

data$thal # "thal"中也有"?",处理同ca
data$thal
## 将hd(heart disease)中的数字(0~4)改成"Healthy" 和"Unhealthy"
data$hd 0, yes="Healthy", no="Unhealthy")
data$hd str(data) #再次核验数据类型
再次查看转换后的数据类型:所有的分类变量被转换成因子型(factor),所有的连续变量保持数值型(num)。
NA值的处理:如果NA较少,可以直接删除;如果NA较多,应该使用随机森林或其他方法替代NA。
## 查看NA个数
table(is.na(data))
# FALSE  TRUE
# 4236     6

##展示含有NA的记录
data[!complete.cases(data),]
#     age sex cp trestbps chol fbs restecg thalach exang oldpeak slope   ca thal        hd
# 88   53   F  3      128  216   0       2     115     0     0.0     1    2    Healthy
# 167  52   M  3      138  223   0       0     169     0     0.0     1     2   Healthy
# 193  43   M  4      132  247   1       2     143     1     0.1     2     4 Unhealthy
# 267  52   M  4      128  204   1       0     156     1     1.0     2    2  Unhealthy
# 288  58   M  2      125  220   0       0     144     0     0.4     2     4   Healthy
# 303  38   M  3      138  175   0       0     173     0     0.0     1     2   Healthy

##去除含NA的样本(6个样本),仅保留完整数据的样本(297个样本)
data nrow(data)
# [1] 297
3. 数据质量控制
### 3 数据质量控制
#  确保因子型数据中的每一个类别都有患者和非患者
#  删除仅含有1-2个样本的类别。因为其对odds或log(odds)有较大的效应量
xtabs(~ hd + sex, data=data)
xtabs(~ hd + cp, data=data)
xtabs(~ hd + fbs, data=data)
xtabs(~ hd + exang, data=data)
xtabs(~ hd + slope, data=data)
xtabs(~ hd + ca, data=data)
xtabs(~ hd + thal, data=data)

xtabs(~ hd + restecg, data=data)  ##restecg事件的类别1仅含有4个样本。暂时保留,观察其对结局判定的影响
#           restecg
#hd           0  1  2
#  Healthy   92  1 67
#  Unhealthy 55  3 79
4. 简单logistic回归(基于单一变量性别预测是否患有心脏病)
# 4 简单logistic回归:基于单一变量(性别)预测患者是否患有心脏病(hd)

## 4.1 查看原始数据
xtabs(~ hd + sex, data=data)
#           sex
# hd         F   M
# Healthy    71  89
# Unhealthy  25 112
## 大多数男性是患者,而大多数女性不是患者
## 男性是患者的优势比更大(112/89);女性是患者的优势比较小(25/71)
## 换句话说,男性增加心脏病发生的优势,男性更容易发生心脏病
glm()执行logistic回归:
## 4.2 进行logistic回归
## glm()是执行广义线性模型(generalized linear models)的函数,
## “hd~sex”表示基于性别预测hd
## 指定binomial family产生广义线性模型,使glm()执行logistic回归而不是其他类型的广义线性模型
## glm()函数一步搞定logistic回归
logistic "binomial")
summary(logistic)查看logistic回归结果:
##查看logistic回归结果
summary(logistic)

# Call:#   glm(formula = hd ~ sex, family = "binomial", data = data)
#
# Deviance Residuals:
#   Min       1Q   Median       3Q      Max
# -1.2765  -1.2765  -0.7768   1.0815   1.6404
#
# Coefficients:#   Estimate Std. Error z value Pr(>|z|)    # (Intercept)  -1.0438     0.2326  -4.488 7.18e-06 ***#   sexM          1.2737     0.2725   4.674 2.95e-06 ***
#   ---
#   Signif. codes:  0 ‘***’ 0.001 ‘**’ 0.01 ‘*’ 0.05 ‘.’ 0.1 ‘ ’ 1
#
# (Dispersion parameter for binomial family taken to be 1)
#
# Null deviance: 409.95  on 296  degrees of freedom
# Residual deviance: 386.12  on 295  degrees of freedom
# AIC: 390.12
#
# Number of Fisher Scoring iterations: 4
logistic回归结果解读:
第一个系数:
            Estimate Std. Error z value Pr(>|z|)
(Intercept)  -1.0438     0.2326  -4.488 7.18e-06 ***
- 截距系数指的是女性患者发生心脏病的优势比的对数,即log(OR)。
- 因子水平:因为在设置因子时,R默认按照字母表顺序进行排序:female(0),male(1)。故female为基线水平,即截距水平。
- 该截距的计算结果与下面的结果相同:
- female.log.odds
第二个系数:
               Estimate Std. Error z value Pr(>|z|)
## (Intercept)  -1.0438     0.2326  -4.488 7.18e-06 ***
##   sexM        1.2737     0.2725   4.674 2.95e-06 ***
结合两个系数,可得出对应的logistic回归曲线方程:
heart disease = -1.0438 + 1.2737 x the patient is male
如果该患者是女性:the patient is male对应数字0。
heart disease = -1.0438 + 1.2737 x 0
如果该患者是男性:the patient is male对应数字1。
heart disease = -1.0438 + 1.2737 x 1
- SexM系数表示如果该样本为男性,其发生心脏病的优势比的对数(log(OR))比女性增加1.27倍。
- SexM系数的计算结果与下面的结果相同:male.log.odds.ratio
- Std.Error和z value是基于Wald检验计算得出,最后一列是相应的p值。这里的p值均小于0.05,故认为logistic回归的系数是具有显著性的。
系数的指数化,增加系数的可读性
exp(logistic$coefficients[1])
# 0.3521127
# 表明女性发生心脏病的优势比为0.35

exp(logistic$coefficients[2])
# 3.573933
# 表明男性发生心脏病的优势比女性增加3.57倍计算伪R2和p值
## 参考: 饱和模型与偏差计算R方与p值## logistic回归中:查看logistic回归的预测结果(基于性别预测是否患病的结果)
predicted.data   probability.of.hd=logistic$fitted.values,
  sex=data$sex)

str(predicted.data)
# 'data.frame': 297 obs. of  2 variables:
# $ probability.of.hd: num  0.557 0.557 0.557 0.557 0.26 ...
# $ sex              : Factor w/ 2 levels "F","M": 2 2 2 2 1 2 1 1 2 2 ...
利用ggplot2 R 包将预测结果可视化:
library("ggplot2")
ggplot(data=predicted.data, aes(x=sex, y=probability.of.hd)) +
  geom_point(aes(color=sex), size=5) +
  xlab("Sex") +
  ylab("Predicted probability of getting heart disease")

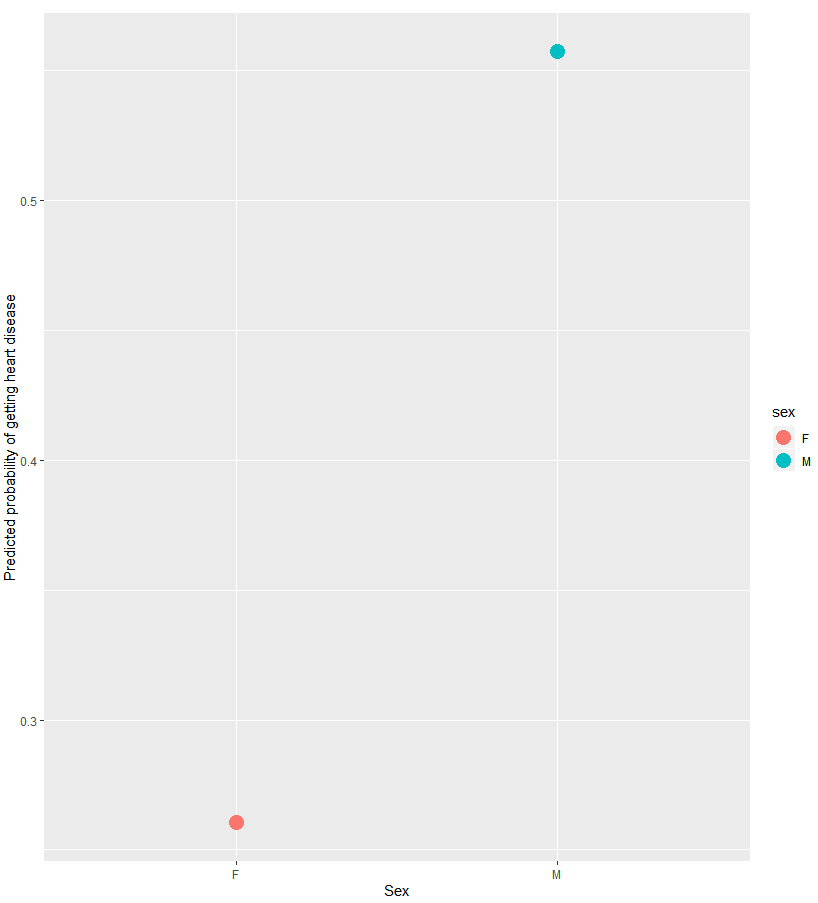
## 在预测结果中,仅有两个概率值(男性一个,女性一个)
## 故可使用交叉表进行汇总预测结果
xtabs(~ probability.of.hd + sex, data=predicted.data)

#                     sex
# probability.of.hd     F   M
#   0.260416666667241  96   0
#   0.55721393034826    0 201
 基于该模型,我们仅能根据性别判断出两个概率,女性发病的概率较低(p=0.26),而男性发病的概率较高(p=0.56)。
5. 较多变量的logistic回归
##"hd~."表示使用数据中所有变量
logistic "binomial")

summary(logistic)
# Call:
# glm(formula = hd ~ ., family = "binomial", data = data)
#
# Deviance Residuals:
#     Min       1Q   Median       3Q      Max
# -3.0490  -0.4847  -0.1213   0.3039   2.9086
#
# Coefficients:
#   Estimate Std. Error z value Pr(>|z|)
# (Intercept) -6.253978   2.960399  -2.113 0.034640 *
# age         -0.023508   0.025122  -0.936 0.349402
# sexM         1.670152   0.552486   3.023 0.002503 **
# cp2          1.448396   0.809136   1.790 0.073446 .
# cp3          0.393353   0.700338   0.562 0.574347
# cp4          2.373287   0.709094   3.347 0.000817 ***
# trestbps     0.027720   0.011748   2.359 0.018300 *
# chol         0.004445   0.004091   1.087 0.277253
# fbs1        -0.574079   0.592539  -0.969 0.332622
# restecg1     1.000887   2.638393   0.379 0.704424
# restecg2     0.486408   0.396327   1.227 0.219713
# thalach     -0.019695   0.011717  -1.681 0.092781 .
# exang1       0.653306   0.447445   1.460 0.144267
# oldpeak      0.390679   0.239173   1.633 0.102373
# slope2       1.302289   0.486197   2.679 0.007395 **
# slope3       0.606760   0.939324   0.646 0.518309
# ca3          2.237444   0.514770   4.346 1.38e-05 ***
# ca4          3.271852   0.785123   4.167 3.08e-05 ***
# ca5          2.188715   0.928644   2.357 0.018428 *
# thal3       -0.168439   0.810310  -0.208 0.835331
# thal4        1.433319   0.440567   3.253 0.001141 **
#   ---
#   Signif. codes:  0 ‘***’ 0.001 ‘**’ 0.01 ‘*’ 0.05 ‘.’ 0.1 ‘ ’ 1
#
# (Dispersion parameter for binomial family taken to be 1)
#
# Null deviance: 409.95  on 296  degrees of freedom
# Residual deviance: 183.10  on 276  degrees of freedom
# AIC: 225.1
#
# Number of Fisher Scoring iterations: 6
输出的结果较多,但是解释的方法同前。一些变量的系数具有显著性,一些变量的系数不具有显著性。
## 计算该模型的 "Pseudo R-squared"和 p-value
ll.null 2
ll.proposed 2## McFadden's Pseudo R^2 = [ LL(Null) - LL(Proposed) ] / LL(Null)
(ll.null - ll.proposed) / ll.null# [1] 0.5533531##R^2的P值1 - pchisq(2*(ll.proposed - ll.null), df=(length(logistic$coefficients)-1))# [1] 0# p值非常小,趋近0## 可视化该模型的预测结果
predicted.data
  probability.of.hd=logistic$fitted.values,
  hd=data$hd)
str(predicted.data)# 'data.frame': 297 obs. of  2 variables:# $ probability.of.hd: num  0.0621 0.9934 0.9979 0.1136 0.0263 ...# $ hd               : Factor w/ 2 levels "Healthy","Unhealthy": 1 2 2 1 1 1 2 1 2 2 ..## 对预测结果进行排序:按照预测发生心脏病的概率大小predicted.data
  order(predicted.data$probability.of.hd, decreasing=FALSE),]
predicted.data$rank 1:nrow(predicted.data)## 可视化预测结果:不同的颜色展示患病或不患病的真实分类ggplot(data=predicted.data, aes(x=rank, y=probability.of.hd)) +
  geom_point(aes(color=hd), alpha=1, shape=4, stroke=2) +
  xlab("Index") +
  ylab("Predicted probability of getting heart disease")
ggsave("heart_disease_probabilities.pdf")
基于较复杂的模型,得出一个连续型的模型。总体而言,该模型能够将绝大部分的患者判定为患者,其对应的患病的p值>0.5;绝大部分的非患者被判定为非患者,其对应患病的p值<0.5。 参考视频:https://www.youtube.com/watch?v=C4N3_XJJ-jU
编辑:吕琼
校审:罗鹏
