2021-01-31
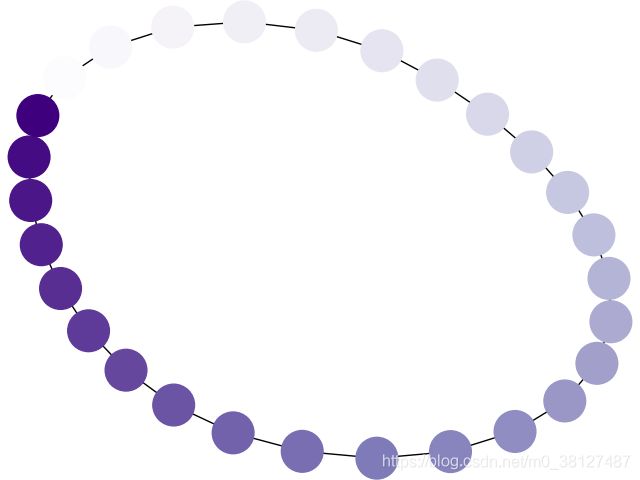
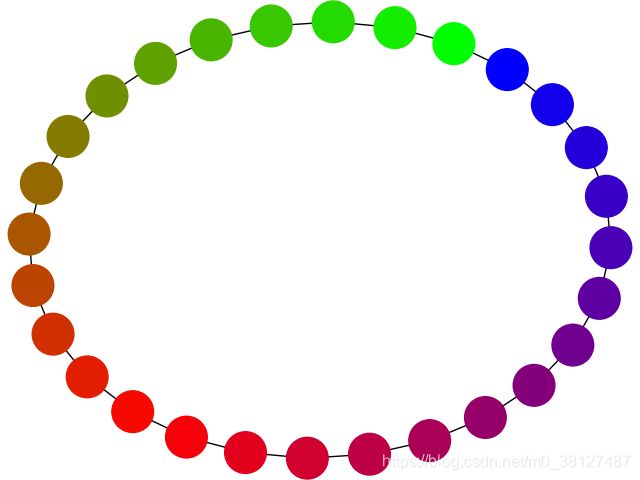
节点颜色Node Colormap
Author: Aric Hagberg ,Chen Xiang Yu([email protected])
import matplotlib.pyplot as plt
import networkx as nx
G = nx.cycle_graph(28)
设置排列位置,iterations迭代次数
pos = nx.spring_layout(G, iterations=300)
node_color节点颜色
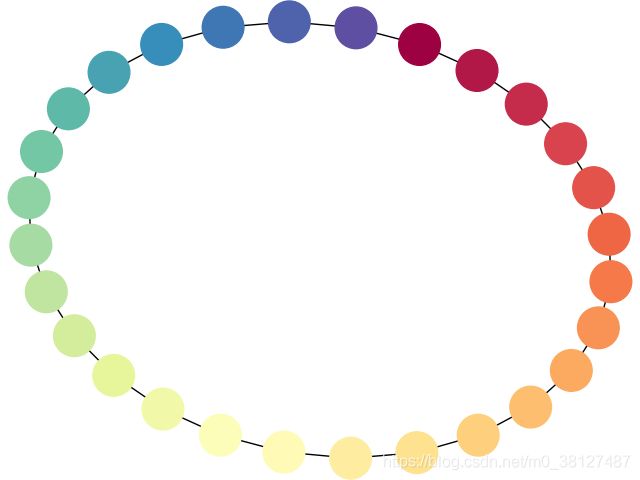
nx.draw(G, pos, node_color=range(28), node_size=900, cmap=“BrBG”)
plt.show()
clear all;
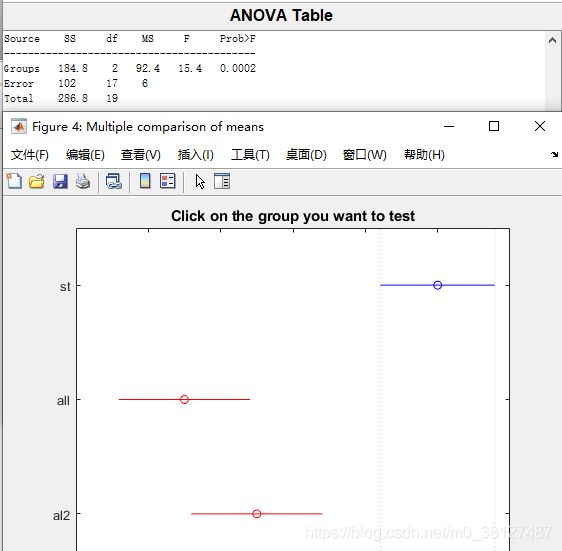
strength=[82 86 79 83 84 85 86 87 74 82 78 75 76 77 79 79 77 78 82 79];
alloy={‘st’,‘st’,‘st’,‘st’,‘st’,‘st’,‘st’,‘st’,…
‘all’,‘all’,‘all’,‘all’,‘all’,‘all’,…
‘al2’,‘al2’,‘al2’,‘al2’,‘al2’,‘al2’};
[p,a,s]=anova1(strength,alloy);
[c,m,h,nums]=multcompare(s);
[nums num2cell©]
multcomparesasd
ans =
3×7 cell 数组
{'st' }    {[1]}    {[2]}    {[ 3.6064]}    {[ 7]}    {[10.3936]}    {[1.6831e-04]}
{'all'}    {[1]}    {[3]}    {[ 1.6064]}    {[ 5]}    {[ 8.3936]}    {[    0.0040]}
{'al2'}    {[2]}    {[3]}    {[-5.6280]}    {[-2]}    {[ 1.6280]}    {[    0.3560]}
clear all;
strength=[82 86 79 83 84 85 86 87 74 82 78 75 76 77 79 79 77 78 82 79 78 75 76 77 79 79 77 78 82 79];
alloy={‘st’,‘st’,‘st’,‘st’,‘st’,‘st’,‘st’,‘st’,‘st’,‘st’,‘st’,‘st’,‘all’,‘all’,‘all’,‘all’,‘all’,‘all’,‘all’,‘all’,‘all’,‘al2’,‘al2’,‘al2’,‘al2’,‘al2’,‘al2’,‘al2’,‘al2’,‘al2’};
[p,a,s]=anova1(strength,alloy);
[c,m,h,nums]=multcompare(s);
[nums num2cell©]


张德丰编著—MATLAB概率与数据统计分析----第305页—【M】北京:机械工业出版社
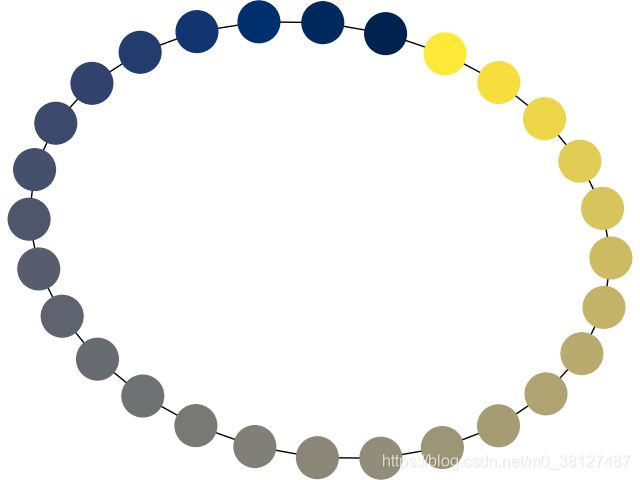
nx.draw(G, pos, node_color=range(28), node_size=900, cmap=“winter_r”)
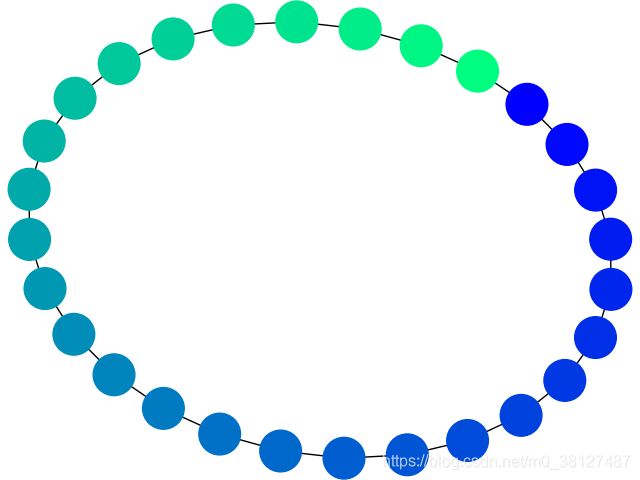
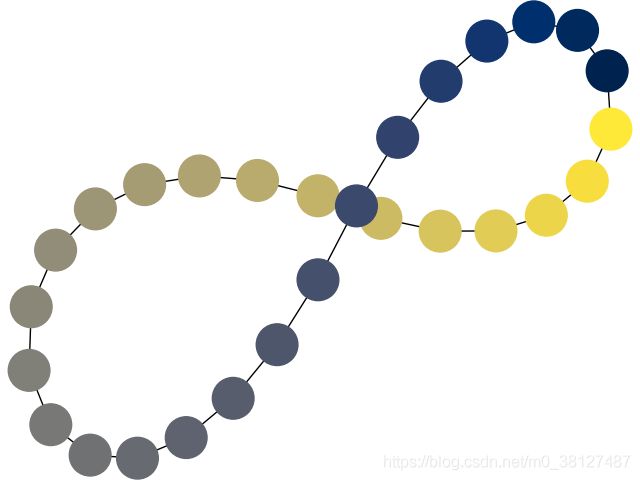
nx.draw(G, pos, node_color=range(28), node_size=900, cmap=“winter”)

nx.draw(G, pos, node_color=range(28), node_size=900, cmap=“tab20c”)

nx.draw(G, pos, node_color=range(28), node_size=900, cmap=“tab20c_r”)

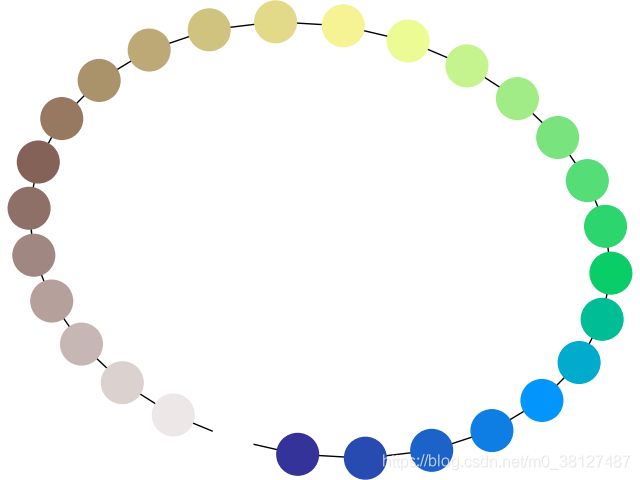
nx.draw(G, pos, node_color=range(28), node_size=900, cmap=“terrain”)
nx.draw(G, pos, node_color=range(28), node_size=900, cmap=“binary”)
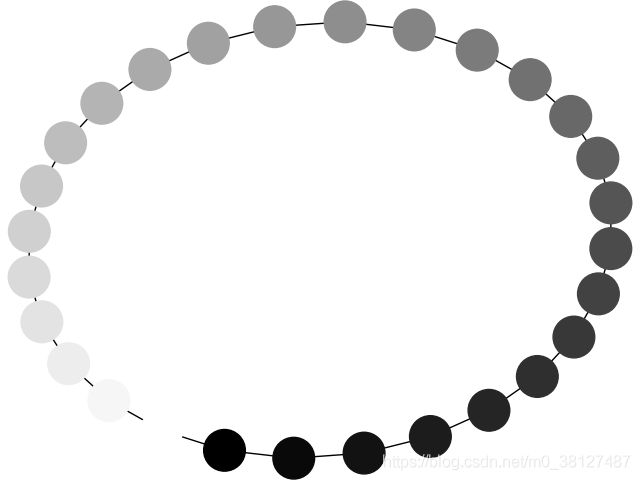
nx.draw(G, pos, node_color=range(28), node_size=900, cmap=“binary_r”)

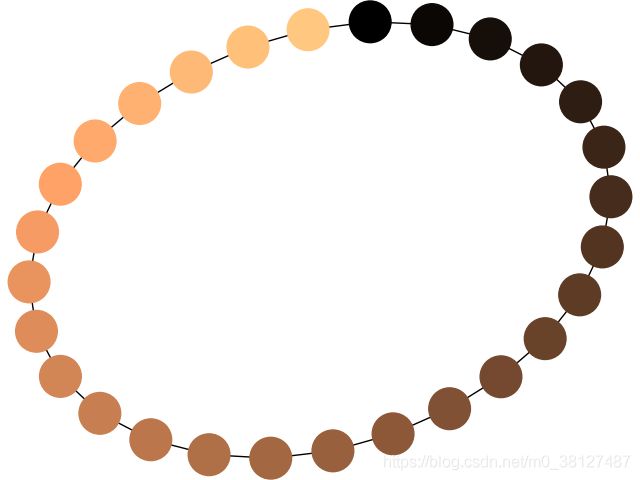
nx.draw(G, pos, node_color=range(28), node_size=900, cmap=“copper”)
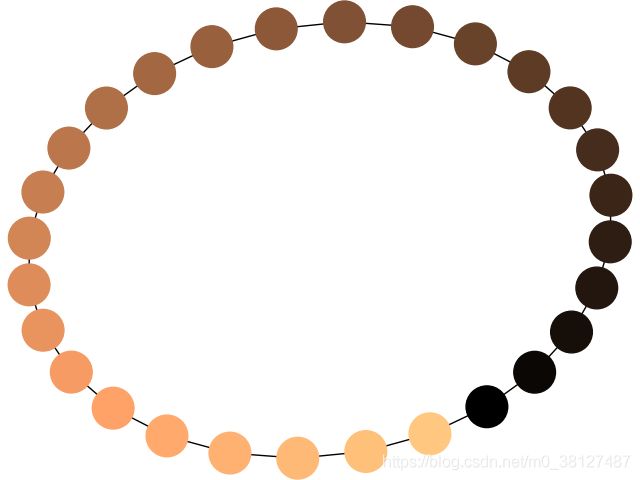
nx.draw(G, pos, node_color=range(28), node_size=900, cmap=“copper_r”)
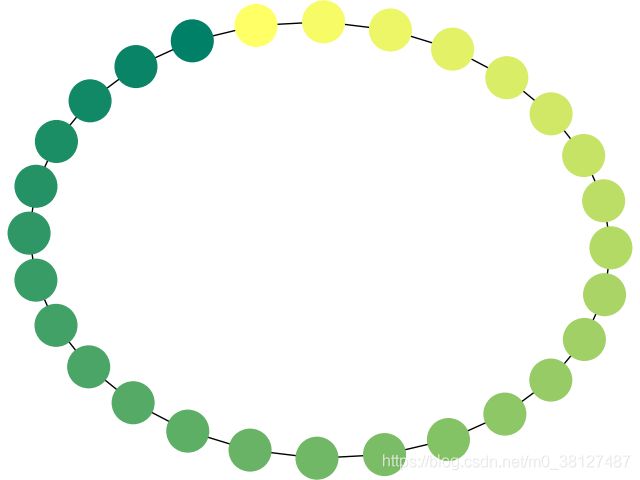
nx.draw(G, pos, node_color=range(28), node_size=900, cmap=“summer”)

nx.draw(G, pos, node_color=range(28), node_size=900, cmap=“summer_r”)




Servlet第三讲:https://v.youku.com/v_show/id_XNTA5MjY1NjM0NA==.html?spm=a2hcb.profile.app.55!255!35!255~A
