go性能分析工具pprof
背景
自己写的代码在运行时,如何进行性能分析呢?go提供了一个叫pprof的工具,可以帮助我们分析
pprof介绍
Go语言内置了获取程序运行数据的工具,包括以下两个标准库:
runtime/pprof: 采集工具型应用运行数据进行分析net/http/pprof: 采集服务型应用运行时数据进行分析
pprof开启后,每隔一段时间(10ms)就会收集当前的堆栈信息,获取各个函数占用的CPU以及内存资源,然后通过对这些采样数据进行分析,形成一个性能分析报告。
性能优化主要有一下几个方面:
-
CPU Profile:报告程序的CPU使用情况,按照一定频率去采集应用程序在CPU和寄存器上面的数据。
-
Memory Profile(Heap Profile):报告程序的内存使用情况。
-
Block Profiling: 报告goroutines不在运行状态的情况,可以用来分析和查找死锁等性能瓶颈。
-
Goroutine Profiling: 报告goroutines的使用情况,有哪些roroutines,它们的调用关系是怎样的。
注意:我们只应该在性能测试的时候才在代码中引入pprof
使用
由于项目中是web服务器,所以 我们选用net/http/pprof。但使用了gin框架,需要稍微修改下,才能接入,好在gin给我们提供了写好的包, 直接import好了。
package main

import (
	"github.com/gin-contrib/pprof"
	"github.com/gin-gonic/gin"
)

func main() {
  router := gin.Default()
  pprof.Register(router)
  router.Run(":8080")
}
编译并运行代码,会发现多了很多个pprof的路由
此时如果要查看cpu的性能情况,可以执行 go tool pprof http://127.0.0.1:8081/debug/pprof/profile,此时会看到如下的输出。
top命令可以查看cpu使用情况的前几名
list 函数名 可以查看函数的cpu使用情况
最后一列为函数名称,其他各项内容意义如下:
-
flat:当前函数占用CPU的耗时
-
flat%:当前函数占用CPU的耗时百分比
-
sum%:函数占用CPU的累积耗时百分比
-
cum:当前函数+调用当前函数的占用CPU总耗时
-
cum%: 当前函数+调用当前函数的占用CPU总耗时百分比
go tool pprof http://127.0.0.1:8081/debug/pprof/profile

Fetching profile over HTTP from http://127.0.0.1:8081/debug/pprof/profile
Saved profile in /Users/gyw/pprof/pprof.samples.cpu.003.pb.gz
Type: cpu
Time: Nov 15, 2020 at 10:01pm (CST)
Duration: 30s, Total samples = 140ms ( 0.47%)
Entering interactive mode (type "help" for commands, "o" for options)
(pprof) top
Showing nodes accounting for 140ms, 100% of 140ms total
Showing top 10 nodes out of 57
      flat  flat%   sum%        cum   cum%
      50ms 35.71% 35.71%       50ms 35.71%  runtime.nanotime1
      30ms 21.43% 57.14%       30ms 21.43%  runtime.pthread_cond_wait
      20ms 14.29% 71.43%       20ms 14.29%  runtime.usleep
      20ms 14.29% 85.71%       20ms 14.29%  syscall.syscall
      10ms  7.14% 92.86%       10ms  7.14%  runtime.kevent
      10ms  7.14%   100%       10ms  7.14%  runtime.pthread_cond_signal
         0     0%   100%       10ms  7.14%  github.com/gin-gonic/gin.(*Context).Next
         0     0%   100%       10ms  7.14%  github.com/gin-gonic/gin.(*Engine).ServeHTTP
         0     0%   100%       10ms  7.14%  github.com/gin-gonic/gin.(*Engine).handleHTTPRequest
         0     0%   100%       10ms  7.14%  github.com/gin-gonic/gin.RecoveryWithWriter.func1
(pprof) list List
Total: 140ms
ROUTINE ======================== controller/btracks.List in /Users/gyw/go/btracks.go
         0       10ms (flat, cum)  7.14% of Total
         .          .     17:   if !xc.GetReqObject(&req) {
         .          .     18:           Logger("unmarshal error")
         .          .     19:           return
         .          .     20:   }
         .          .     21:   id := xc.Request.Header.Get(def.XMidKeyName)
         .       10ms     22:   Logger(xc, "list get mid", "mid", mid)
         .          .     23:
         .          .     24:   resp, err := btrackService.List(xc, &req, mid)
         .          .     25:   if err != nil {
         .          .     26:           Logger("fail list", "err", err, "req", req, "mid", mid)
         .          .     27:           xc.Reply(lib.CodeNotExist)
(pprof)
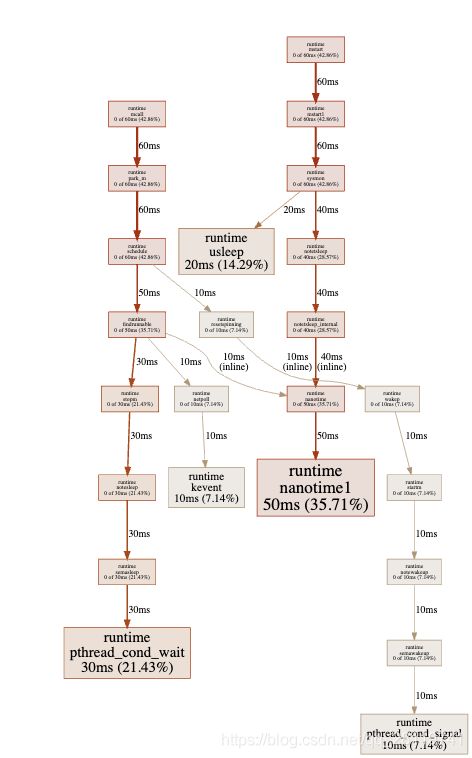
还有一个比较好用的可视化命令,输入web,会打开本地浏览器查看pprof的svg图来分析
注意:
1.这个web命令需要在生成的机器上安装graphviz
2.如果在无界面的服务器上如何生成可视化呢?不需要服务器上安装graphviz,只需要上面第一步演示中生成的/Users/gyw/pprof/pprof.samples.cpu.003.pb.gz文件了。
把这个文件下到本地,本地有对应的环境,然后执行下面的命令
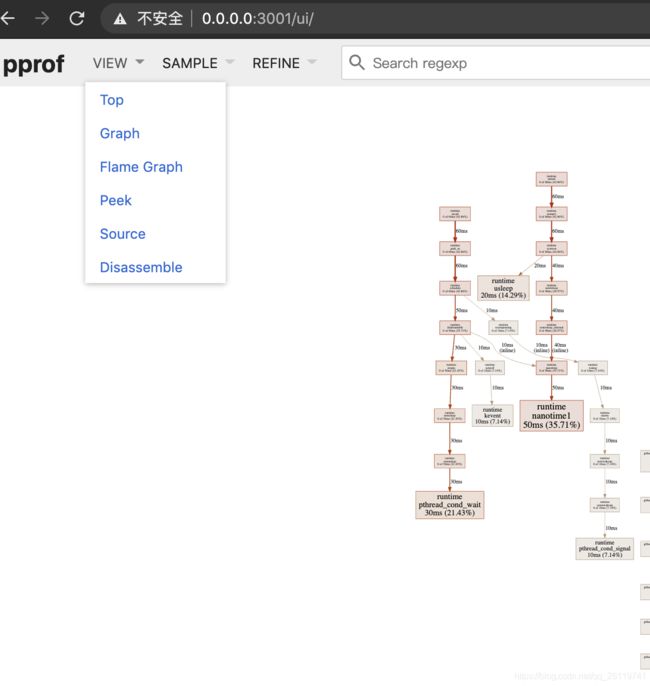
go tool pprof -http 0.0.0.0:3001 /Users/gyw/pprof/pprof.samples.cpu.003.pb.gz,此时会自动弹出一个可视化界面,这时候发现这个界面东西功能更多更全了,甚至还有火焰图。
实战分析
参考
https://artem.krylysov.com/blog/2017/03/13/profiling-and-optimizing-go-web-applications/
https://github.com/gin-contrib/cors
https://lihaoquan.me/2017/1/1/Profiling-and-Optimizing-Go-using-go-torch.html
http://liumurong.org/2019/12/gin_pprof/
https://golang.org/pkg/runtime/pprof/#StartCPUProfile


