机器学习之监督学习--(分类)非线性逻辑回归
注:数据集放在文章末尾
(1)非线性逻辑回归 —— 梯度下降法
import matplotlib.pyplot as plt
import numpy as np
from sklearn.metrics import classification_report
from sklearn import preprocessing
from sklearn.preprocessing import PolynomialFeatures
# 数据是否需要标准化
scale = False

# 载入数据
data = np.genfromtxt("LR-testSet2.txt", delimiter=",")
x_data = data[:,:-1]
y_data = data[:,-1,np.newaxis]

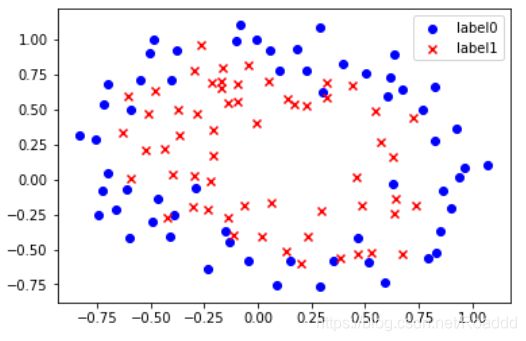
def plot():
    x0 = []
    x1 = []
    y0 = []
    y1 = []
    # 切分不同类别的数据
    for i in range(len(x_data)):
        if y_data[i]==0:
            x0.append(x_data[i,0])
            y0.append(x_data[i,1])
        else:
            x1.append(x_data[i,0])
            y1.append(x_data[i,1])

    # 画图
    scatter0 = plt.scatter(x0, y0, c='b', marker='o')
    scatter1 = plt.scatter(x1, y1, c='r', marker='x')
    #画图例
    plt.legend(handles=[scatter0,scatter1],labels=['label0','label1'],loc='best')

plot()
plt.show()
# 定义多项式回归,degree的值可以调节多项式的特征
poly_reg  = PolynomialFeatures(degree=3)
# 特征处理
x_poly = poly_reg.fit_transform(x_data)

def sigmoid(x):
    return 1.0/(1+np.exp(-x))

def cost(xMat, yMat, ws):
    left = np.multiply(yMat, np.log(sigmoid(xMat*ws)))
    right = np.multiply(1 - yMat, np.log(1 - sigmoid(xMat*ws)))
    return np.sum(left + right) / -(len(xMat))

def gradAscent(xArr, yArr):

    if scale == True:
        xArr = preprocessing.scale(xArr)
    xMat = np.mat(xArr)
    yMat = np.mat(yArr)

    lr = 0.03
    epochs = 50000
    costList = []
    # 计算数据列数,有几列就有几个权值
    m,n = np.shape(xMat)
    # 初始化权值
    ws = np.mat(np.ones((n,1)))

    for i in range(epochs+1):
        # xMat和weights矩阵相乘
        h = sigmoid(xMat*ws)
        # 计算误差
        ws_grad = xMat.T*(h - yMat)/m
        ws = ws - lr*ws_grad

        if i % 50 == 0:
            costList.append(cost(xMat,yMat,ws))
    return ws,costList

# 训练模型,得到权值和cost值的变化
ws,costList = gradAscent(x_poly, y_data)
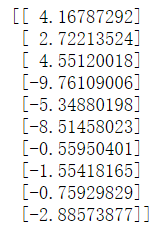
print(ws)
# 获取数据值所在的范围
x_min, x_max = x_data[:, 0].min() - 1, x_data[:, 0].max() + 1
y_min, y_max = x_data[:, 1].min() - 1, x_data[:, 1].max() + 1

# 生成网格矩阵
xx, yy = np.meshgrid(np.arange(x_min, x_max, 0.02),
                     np.arange(y_min, y_max, 0.02))

# np.r_按row来组合array,
# np.c_按colunm来组合array
# >>> a = np.array([1,2,3])
# >>> b = np.array([5,2,5])
# >>> np.r_[a,b]
# array([1, 2, 3, 5, 2, 5])
# >>> np.c_[a,b]
# array([[1, 5],
#        [2, 2],
#        [3, 5]])
# >>> np.c_[a,[0,0,0],b]
# array([[1, 0, 5],
#        [2, 0, 2],
#        [3, 0, 5]])
z = sigmoid(poly_reg.fit_transform(np.c_[xx.ravel(), yy.ravel()]).dot(np.array(ws)))# ravel与flatten类似,多维数据转一维。flatten不会改变原始数据,ravel会改变原始数据
for i in range(len(z)):
    if z[i] > 0.5:
        z[i] = 1
    else:
        z[i] = 0
z = z.reshape(xx.shape)

# 等高线图
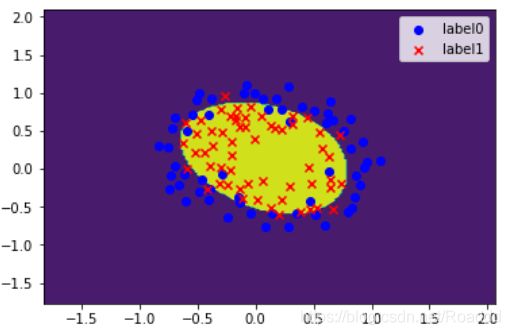
cs = plt.contourf(xx, yy, z)
plot()
plt.show()
# 预测
def predict(x_data, ws):
#     if scale == True:
#         x_data = preprocessing.scale(x_data)
    xMat = np.mat(x_data)
    ws = np.mat(ws)
    return [1 if x >= 0.5 else 0 for x in sigmoid(xMat*ws)]

predictions = predict(x_poly, ws)

print(classification_report(y_data, predictions))
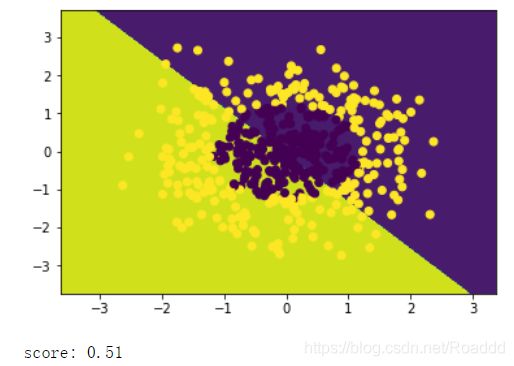
(2)非线性逻辑回归 —— sklearn
import numpy as np
import matplotlib.pyplot as plt
from sklearn import linear_model
from sklearn.datasets import make_gaussian_quantiles
from sklearn.preprocessing import PolynomialFeatures

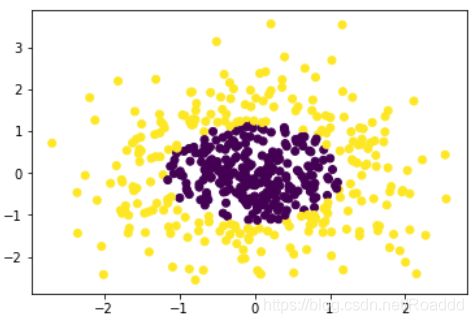
# 生成2维正态分布,生成的数据按分位数分为两类,500个样本,2个样本特征
# 可以生成两类或多类数据
x_data, y_data = make_gaussian_quantiles(n_samples=500, n_features=2,n_classes=2)

plt.scatter(x_data[:, 0], x_data[:, 1], c=y_data)
plt.show()
logistic = linear_model.LogisticRegression()
logistic.fit(x_data, y_data)

# 获取数据值所在的范围
x_min, x_max = x_data[:, 0].min() - 1, x_data[:, 0].max() + 1
y_min, y_max = x_data[:, 1].min() - 1, x_data[:, 1].max() + 1

# 生成网格矩阵
xx, yy = np.meshgrid(np.arange(x_min, x_max, 0.02),
                     np.arange(y_min, y_max, 0.02))

# np.r_按row来组合array,
# np.c_按colunm来组合array
# >>> a = np.array([1,2,3])
# >>> b = np.array([5,2,5])
# >>> np.r_[a,b]
# array([1, 2, 3, 5, 2, 5])
# >>> np.c_[a,b]
# array([[1, 5],
#        [2, 2],
#        [3, 5]])
# >>> np.c_[a,[0,0,0],b]
# array([[1, 0, 5],
#        [2, 0, 2],
#        [3, 0, 5]])
z = logistic.predict(np.c_[xx.ravel(), yy.ravel()])# ravel与flatten类似,多维数据转一维。flatten不会改变原始数据,ravel会改变原始数据
z = z.reshape(xx.shape)
# 等高线图
cs = plt.contourf(xx, yy, z)
# 样本散点图
plt.scatter(x_data[:, 0], x_data[:, 1], c=y_data)
plt.show()

print('score:',logistic.score(x_data,y_data))
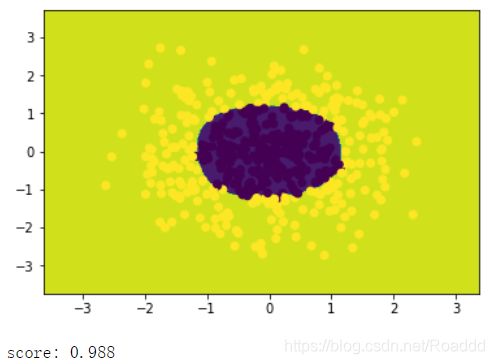
# 定义多项式回归,degree的值可以调节多项式的特征
poly_reg  = PolynomialFeatures(degree=5)
# 特征处理
x_poly = poly_reg.fit_transform(x_data)
# 定义逻辑回归模型
logistic = linear_model.LogisticRegression()
# 训练模型
logistic.fit(x_poly, y_data)

# 获取数据值所在的范围
x_min, x_max = x_data[:, 0].min() - 1, x_data[:, 0].max() + 1
y_min, y_max = x_data[:, 1].min() - 1, x_data[:, 1].max() + 1

# 生成网格矩阵
xx, yy = np.meshgrid(np.arange(x_min, x_max, 0.02),
                     np.arange(y_min, y_max, 0.02))

# np.r_按row来组合array,
# np.c_按colunm来组合array
# >>> a = np.array([1,2,3])
# >>> b = np.array([5,2,5])
# >>> np.r_[a,b]
# array([1, 2, 3, 5, 2, 5])
# >>> np.c_[a,b]
# array([[1, 5],
#        [2, 2],
#        [3, 5]])
# >>> np.c_[a,[0,0,0],b]
# array([[1, 0, 5],
#        [2, 0, 2],
#        [3, 0, 5]])
z = logistic.predict(poly_reg.fit_transform(np.c_[xx.ravel(), yy.ravel()]))# ravel与flatten类似,多维数据转一维。flatten不会改变原始数据,ravel会改变原始数据
z = z.reshape(xx.shape)
# 等高线图
cs = plt.contourf(xx, yy, z)
# 样本散点图
plt.scatter(x_data[:, 0], x_data[:, 1], c=y_data)
plt.show()

print('score:',logistic.score(x_poly,y_data))
0.051267,0.69956,1
-0.092742,0.68494,1
-0.21371,0.69225,1
-0.375,0.50219,1
-0.51325,0.46564,1
-0.52477,0.2098,1
-0.39804,0.034357,1
-0.30588,-0.19225,1
0.016705,-0.40424,1
0.13191,-0.51389,1
0.38537,-0.56506,1
0.52938,-0.5212,1
0.63882,-0.24342,1
0.73675,-0.18494,1
0.54666,0.48757,1
0.322,0.5826,1
0.16647,0.53874,1
-0.046659,0.81652,1
-0.17339,0.69956,1
-0.47869,0.63377,1
-0.60541,0.59722,1
-0.62846,0.33406,1
-0.59389,0.005117,1
-0.42108,-0.27266,1
-0.11578,-0.39693,1
0.20104,-0.60161,1
0.46601,-0.53582,1
0.67339,-0.53582,1
-0.13882,0.54605,1
-0.29435,0.77997,1
-0.26555,0.96272,1
-0.16187,0.8019,1
-0.17339,0.64839,1
-0.28283,0.47295,1
-0.36348,0.31213,1
-0.30012,0.027047,1
-0.23675,-0.21418,1
-0.06394,-0.18494,1
0.062788,-0.16301,1
0.22984,-0.41155,1
0.2932,-0.2288,1
0.48329,-0.18494,1
0.64459,-0.14108,1
0.46025,0.012427,1
0.6273,0.15863,1
0.57546,0.26827,1
0.72523,0.44371,1
0.22408,0.52412,1
0.44297,0.67032,1
0.322,0.69225,1
0.13767,0.57529,1
-0.0063364,0.39985,1
-0.092742,0.55336,1
-0.20795,0.35599,1
-0.20795,0.17325,1
-0.43836,0.21711,1
-0.21947,-0.016813,1
-0.13882,-0.27266,1
0.18376,0.93348,0
0.22408,0.77997,0
0.29896,0.61915,0
0.50634,0.75804,0
0.61578,0.7288,0
0.60426,0.59722,0
0.76555,0.50219,0
0.92684,0.3633,0
0.82316,0.27558,0
0.96141,0.085526,0
0.93836,0.012427,0
0.86348,-0.082602,0
0.89804,-0.20687,0
0.85196,-0.36769,0
0.82892,-0.5212,0
0.79435,-0.55775,0
0.59274,-0.7405,0
0.51786,-0.5943,0
0.46601,-0.41886,0
0.35081,-0.57968,0
0.28744,-0.76974,0
0.085829,-0.75512,0
0.14919,-0.57968,0
-0.13306,-0.4481,0
-0.40956,-0.41155,0
-0.39228,-0.25804,0
-0.74366,-0.25804,0
-0.69758,0.041667,0
-0.75518,0.2902,0
-0.69758,0.68494,0
-0.4038,0.70687,0
-0.38076,0.91886,0
-0.50749,0.90424,0
-0.54781,0.70687,0
0.10311,0.77997,0
0.057028,0.91886,0
-0.10426,0.99196,0
-0.081221,1.1089,0
0.28744,1.087,0
0.39689,0.82383,0
0.63882,0.88962,0
0.82316,0.66301,0
0.67339,0.64108,0
1.0709,0.10015,0
-0.046659,-0.57968,0
-0.23675,-0.63816,0
-0.15035,-0.36769,0
-0.49021,-0.3019,0
-0.46717,-0.13377,0
-0.28859,-0.060673,0
-0.61118,-0.067982,0
-0.66302,-0.21418,0
-0.59965,-0.41886,0
-0.72638,-0.082602,0
-0.83007,0.31213,0
-0.72062,0.53874,0
-0.59389,0.49488,0
-0.48445,0.99927,0
-0.0063364,0.99927,0
0.63265,-0.030612,0
