garch预测 python_Python实战—基于GARCH模型股票趋势预测
 模型介绍GARCH模型称为广义ARCH模型,是ARCH模型的拓展,由Bollerslev(1986)发展起来的。它是ARCH模型的推广。GARCH(p,0)模型,相当于ARCH(p)模型。
数据来源
本文所使用的数据来源于联通的股票数据,数据来源于网络。
import numpy as np #导入包import pandas as pdimport matplotlib.pylab as pltimport statsmodels.api as smdf=pd.read_csv('中国联通.csv',encoding='utf-8',index_col='date') #导入数据df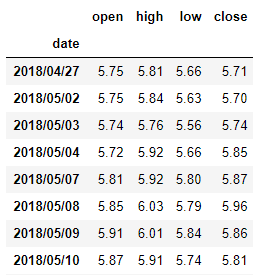 序列识别
序列识别
from datetime import datetime #导入datetime模块df.index=pd.to_datetime(df.index) #转换数据格式ts=df['open']ts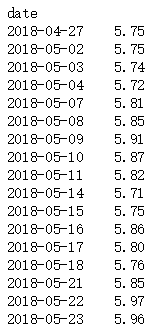
ts.head() #查看数据前五个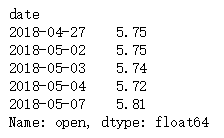
plt.rcParams['font.sans-serif'] = ['simhei'] #字体为黑体plt.rcParams['axes.unicode_minus'] = False #正常显示负号 #时序图的绘制ts.plot()plt.xticks(rotation=45) #坐标角度旋转plt.xlabel('日期') #横、纵坐标以及标题命名plt.ylabel('开盘价')plt.title('中国联通开盘价',loc='center')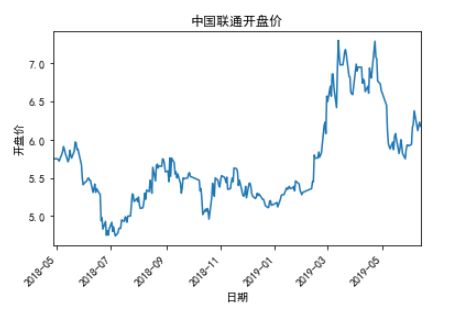
from statsmodels.tsa.stattools import adfuller #ADF单位根检验result = adfuller(ts) #不能拒绝原假设,即原序列存在单位根print(result)ts1= ts.diff().dropna() #一阶差分再进行ADF检验result = adfuller(ts1)print(result)plt.rcParams['font.sans-serif'] = ['simhei'] #字体为黑体plt.rcParams['axes.unicode_minus'] = False #正常显示负号plt.xticks(rotation=45) #坐标角度旋转plt.xlabel('日期') #横、纵坐标以及标题命名plt.ylabel('开盘价')plt.title('差分后的开盘价',loc='center')ts1.plot()plt.show() #一阶差分后的时序图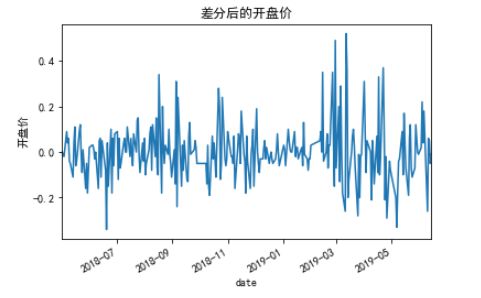
from statsmodels.tsa import stattools #白噪声检验:Ljung-Box检验LjungBox=stattools.q_stat(stattools.acf(ts1)[1:12],len(ts1))[1] #显示第一个到第11个白噪声检验的p值LjungBox #检验的p值大于0.05,因此不能拒绝原假设,差分后序列白噪声检验通过 模型识别与定阶
from statsmodels.tsa.arima_model import ARIMA #导入ARIMA模型model=ARIMA(ts,order=(1,1,0)) #白噪声检验通过,直接确定模型result=model.fit(disp=-1)result.summary() #提取模型信息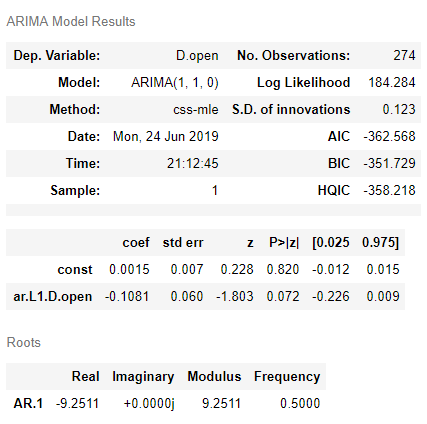
from statsmodels.graphics.tsaplots import plot_acf, plot_pacf #导入自相关和偏自相关包plot_acf(ts1,use_vlines=True,lags=30) #自相关函数图,滞后30阶plt.show()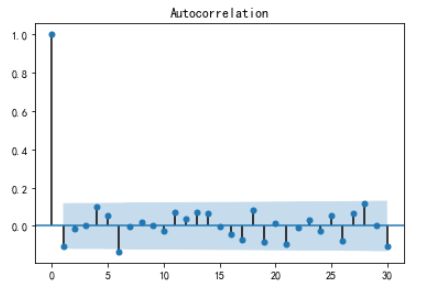
plot_pacf(ts1,use_vlines=True,lags=30) #偏自相关函数图plt.show()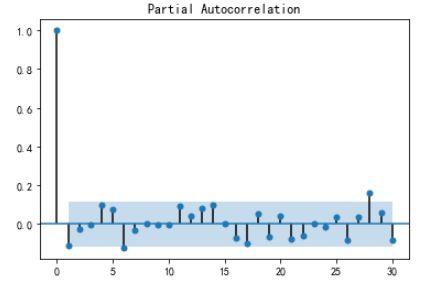
train_results = sm.tsa.arma_order_select_ic(ts1, ic=['aic', 'bic'], trend='nc', max_ar=8, max_ma=8)print('AIC', train_results.aic_min_order) #建立AIC值最小的模型# print('BIC', train_results.bic_min_order)model = ARIMA(ts,(2,1,2)).fit()model.summary() #提取模型系数等信息,保留三位小数;summary2保留四位小数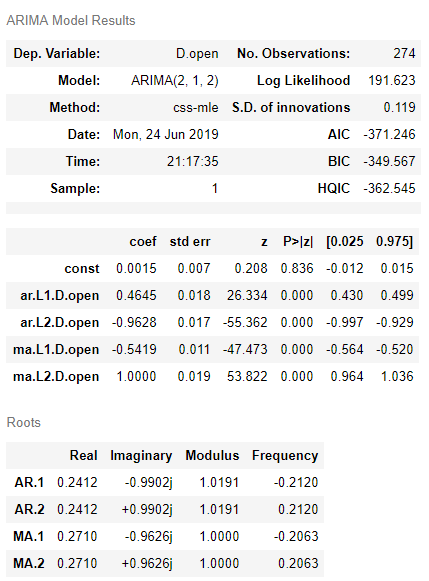 模型诊断
模型诊断
model.conf_int() #系数显著性检验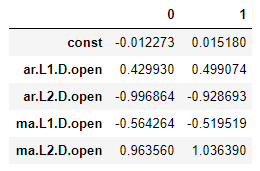
import mathstdresid=model.resid/math.sqrt(model.sigma2) #标准化残差plt.rcParams['font.sans-serif'] = ['simhei'] #字体为黑体plt.rcParams['axes.unicode_minus'] = False #正常显示负号plt.plot(stdresid) #标准化残差序列图plt.xticks(rotation=45) #坐标角度旋转plt.xlabel('日期') #横、纵坐标以及标题命名plt.ylabel('标准化残差')plt.title('标准化残差序列图',loc='center')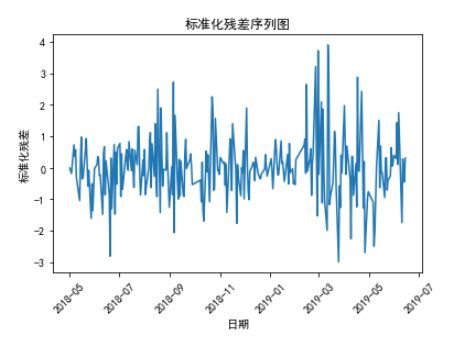
plot_acf(stdresid,lags=30) plt.show()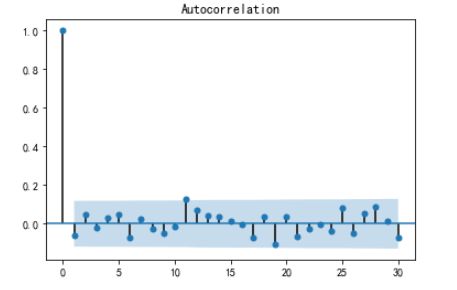
from statsmodels.tsa import stattools #残差序列的白噪声检验LjungBox=stattools.q_stat(stattools.acf(stdresid)[1:13],len(stdresid))LjungBox[1][-1] #LjungBox检验的最后一个P值,大于0.05,通过白噪声检验a=model.forecast(5)a
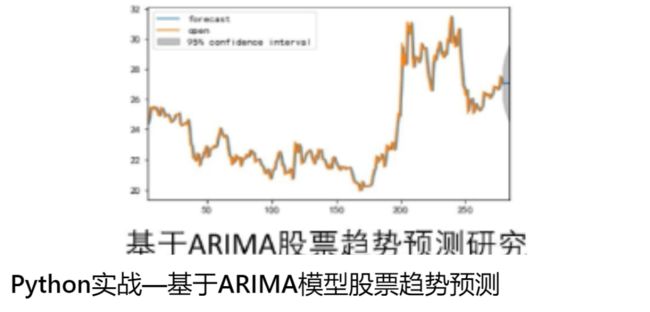
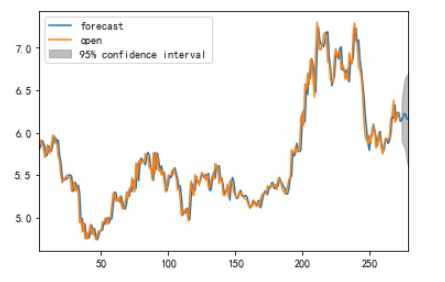
fig, ax = plt.subplots(figsize=(6, 4))ax = ts.ix['2018-09':].plot(ax=ax)plt.show()fig = model.plot_predict(5,280)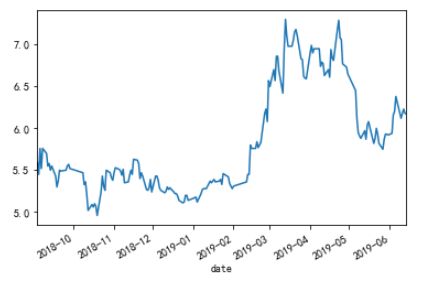
ARCH模型
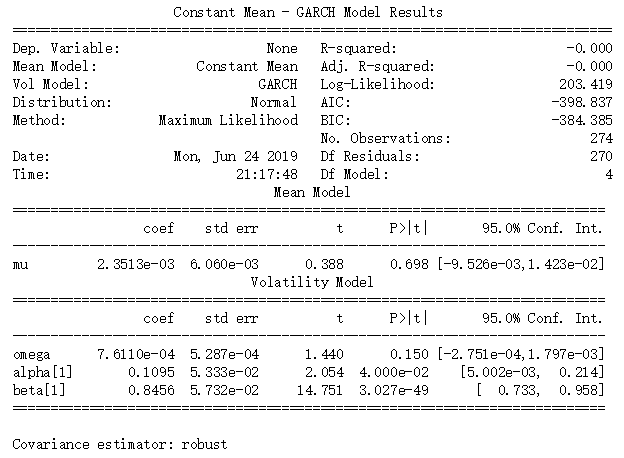
resid1=result.resid #提取残差LjungBox=stattools.q_stat(stattools.acf(resid1**2)[1:13],len(resid1)) #残差平方序列的白噪声检验LjungBox[1][-1] #拒绝原假设,则残差序列具有ARCH效应from arch import arch_modelam=arch_model(resid1) #默认模型为GARCH(1,1)model2=am.fit(update_freq=0) #估计参数
print(model2.summary())