python分类分析--决策树算法原理及案例
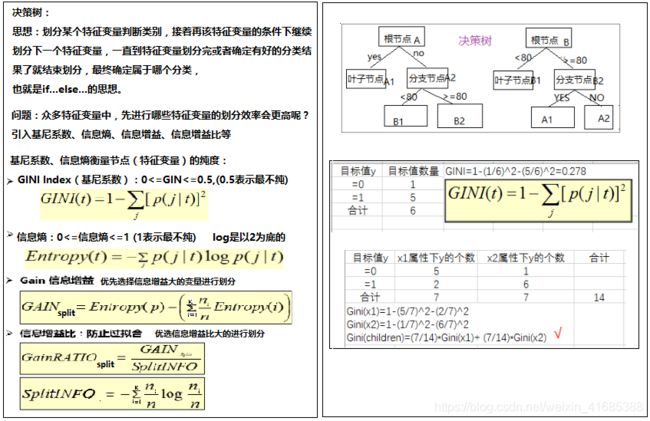
1、决策树概括
- 目标值是分类型变量,特征值(属性值/自变量)可以是分类型,也可以是连续型。
2、决策树的划分依据—信息增益、信息增益比
决策树的生成:
- 贪婪算法:只能局部最优(具有单一属性分类的节点最佳,到此节点认为分类达到准确)
- 根据某一属性对数据进行分裂,以达到某一标准的最优值
3、3种决策树的原理
·ID3
准则:信息增益最大的准则
·C4.5
。信息增益比最大的准则
·CART
。分类树:基尼系数(GINI)最小的准则在sklearn中可以选择划分的默认原则
。优势;划分更加细致(从后面例子的树显示来理解)
4、决策树API
·class sklearn.tree.DecisionTreeClassifier(criterion='gini',max_depth=None,random_state=None)
    。决策树分类8器
    。criterion:默认是'gini'系数,也可以选择信息增益的'entropy'
    。max_depth:树的深度大小
    。random_state:随机数种子
5、tree可视化
安装GraphViz
下载地址:https://graphviz.gitlab.io/_pages/Download/Download_windows.html
选择msi文件下载,安装即可。安装完成后,将bin目录加入到系统path环境变量中
安装graphviz的python库
使用conda install python-graphviz(或者 pip install graphviz)命令安装即可
安装pydotplus
cmd下pip install pydotplus
生成树文本的API:
sklearn.tree.export_graphviz(estimator,out_file='tree.dot',feature_names=["","",...]) #该函数能够导出DOT格式

tree.export_graphviz(模型预估器,导出目录,特征值(变量)名称)
可视化展现API
网站:http://webgraphviz.com/    然后粘贴tree.dot,并执行(需要安装和配置环境变量)

或者:打开cmd,切换到tree.dot目录下,执行:dot -Tpdf tree.dot -o output.pdf ,打开pdf
6、案例实现
from sklearn import datasets      #机器学习数据集库
from sklearn.model_selection import train_test_split  #数据集划分
from sklearn.tree import DecisionTreeClassifier   #可以按照ginf系数或者信息增益entropy的决策树算法
from sklearn.model_selection import GridSearchCV    #网格搜索和交叉验证
from sklearn.tree import export_graphviz  #决策树可视化文件生成

'''# 1 获取数据:使用datasets.load_iris的数据'''
#sklearn.datasets.load_*()        # *:表示某个数据集的名称,load_:获取小规模数据集
df = datasets.load_iris()       #iris:花的数据集
# display(df.data)  #返回特征值(自变量)数组
# display(df.target) #返回目标值(因变量)数组
# print(df["DESCR"]) #返回描述信息
# display(df["feature_names"]) #返回特征值的字段名称
# display(df.feature_names) #返回特征值的字段名称
# display(df.target_names) #返回目标值数字对应解释

'''# 2 数据清新(略)'''

'''# 3 数据集划分'''
x_train,x_test,y_train,y_test = train_test_split(df.data,df.target,test_size=0.25,random_state=11)
print(x_train.shape,x_test.shape,y_train.shape,y_test.shape)

'''# 4 特征工程(略)'''

'''# 5、tree预估器训练模及型选择'''
#实例化一个转换器类
#estimator = DecisionTreeClassifier(criterion='gint',max_depth=None,random_state=11)

#加入模型选择与调优,网格搜索和交叉验证
#网格搜索和交叉验证原理:下一集
estimator = DecisionTreeClassifier(random_state=11)
#准备参数
param_dict = {
     "criterion":['entropy','gini']}
estimator = GridSearchCV(estimator,param_grid=param_dict,cv=10) #cv=10是10折交叉验证

#执行预估器
estimator.fit(x_train,y_train)

'''# 6、模型评估选择'''
#方法1:比对真实值和预测值
y_predict = estimator.predict(x_test)  #计算预测值
print(y_predict)
#方法2:直接计算准确率
accuracy=estimator.score(x_test,y_test)
print(accuracy)

# 3、查看网格搜索和交叉验证返回结果
# 最佳参数:best_params_
print("最佳参数k:",estimator.best_params_)
# 验证集的最佳结果:best_score_
print("验证集的最佳结果准确率:",estimator.best_score_)
# 最佳估计器:best_estimator_
print("最佳估计器",estimator.best_estimator_)
# 交叉验证结果:cv_results_
# print(estimator.cv_results_)  #比较长这里就不输出了

'''tree可视化文件.dot的生成'''
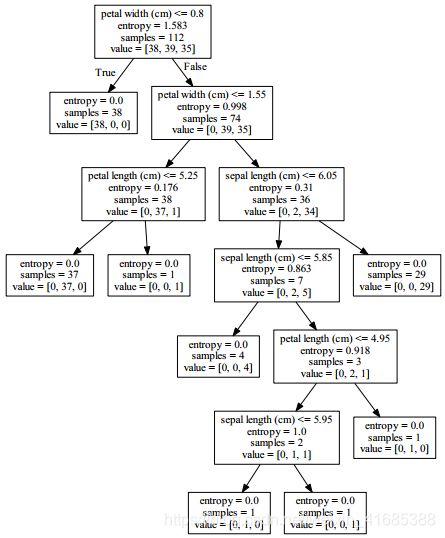
export_graphviz(estimator.best_estimator_,out_file=r'tree.dot',feature_names=df.feature_names)
#estimator.best_estimator_ :使用最终估计器
# 然后打开cmd,切换到tree.dot目录下,执行:dot -Tpdf tree.dot -o output.pdf ,打开pdf
['sepal length (cm)',
 'sepal width (cm)',
 'petal length (cm)',
 'petal width (cm)']


['sepal length (cm)',
 'sepal width (cm)',
 'petal length (cm)',
 'petal width (cm)']


(112, 4) (38, 4) (112,) (38,)
[2 2 1 2 2 0 1 0 0 1 1 1 1 2 2 0 2 1 2 2 1 0 0 1 0 0 1 1 0 2 0 2 2 0 0 2 2
 2]
0.8421052631578947
最佳参数k: {'criterion': 'entropy'}
验证集的最佳结果准确率: 0.9642857142857143
最佳估计器 DecisionTreeClassifier(class_weight=None, criterion='entropy', max_depth=None,
            max_features=None, max_leaf_nodes=None,
            min_impurity_decrease=0.0, min_impurity_split=None,
            min_samples_leaf=1, min_samples_split=2,
            min_weight_fraction_leaf=0.0, presort=False, random_state=11,
            splitter='best')


