关于支持向量机(SVM)算法应用——人脸识别python代码修改
原始代码
关于相关库:
sklearn
matplotlib
numpy
scipy
推荐直接搭建Anoconda环境,直接conda install 。。。 即可下载相应库。
搭建Anoconda环境连接: Anaconda完全入门指南
可以直接使用Anoconda自带解释器spyder
from __future__ import print_function    //for using Python3

from time import time
import logging
import matplotlib.pyplot as plt

from sklearn.cross_validation import train_test_split
from sklearn.datasets import fetch_lfw_people
from sklearn.grid_search import GridSearchCV
from sklearn.metrics import classification_report
from sklearn.metrics import confusion_matrix
from sklearn.decomposition import RandomizedPCA
from sklearn.svm import SVC


print(__doc__)

# Display progress logs on stdout
logging.basicConfig(level=logging.INFO, format='%(asctime)s %(message)s')


###############################################################################
# Download the data, if not already on disk and load it as numpy arrays

lfw_people = fetch_lfw_people(min_faces_per_person=70, resize=0.4)

# introspect the images arrays to find the shapes (for plotting)
n_samples, h, w = lfw_people.images.shape

# for machine learning we use the 2 data directly (as relative pixel
# positions info is ignored by this model)
X = lfw_people.data
n_features = X.shape[1]

# the label to predict is the id of the person
y = lfw_people.target
target_names = lfw_people.target_names
n_classes = target_names.shape[0]

print("Total dataset size:")
print("n_samples: %d" % n_samples)
print("n_features: %d" % n_features)
print("n_classes: %d" % n_classes)


###############################################################################
# Split into a training set and a test set using a stratified k fold

# split into a training and testing set
X_train, X_test, y_train, y_test = train_test_split(
    X, y, test_size=0.25)


###############################################################################
# Compute a PCA (eigenfaces) on the face dataset (treated as unlabeled
# dataset): unsupervised feature extraction / dimensionality reduction
n_components = 150

print("Extracting the top %d eigenfaces from %d faces"
      % (n_components, X_train.shape[0]))
t0 = time()
pca = RandomizedPCA(n_components=n_components, whiten=True).fit(X_train)
print("done in %0.3fs" % (time() - t0))

eigenfaces = pca.components_.reshape((n_components, h, w))

print("Projecting the input data on the eigenfaces orthonormal basis")
t0 = time()
X_train_pca = pca.transform(X_train)
X_test_pca = pca.transform(X_test)
print("done in %0.3fs" % (time() - t0))


###############################################################################
# Train a SVM classification model

print("Fitting the classifier to the training set")
t0 = time()
param_grid = {'C': [1e3, 5e3, 1e4, 5e4, 1e5],
              'gamma': [0.0001, 0.0005, 0.001, 0.005, 0.01, 0.1], }
clf = GridSearchCV(SVC(kernel='rbf', class_weight='auto'), param_grid)
clf = clf.fit(X_train_pca, y_train)
print("done in %0.3fs" % (time() - t0))
print("Best estimator found by grid search:")
print(clf.best_estimator_)


###############################################################################
# Quantitative evaluation of the model quality on the test set

print("Predicting people's names on the test set")
t0 = time()
y_pred = clf.predict(X_test_pca)
print("done in %0.3fs" % (time() - t0))

print(classification_report(y_test, y_pred, target_names=target_names))
print(confusion_matrix(y_test, y_pred, labels=range(n_classes)))


###############################################################################
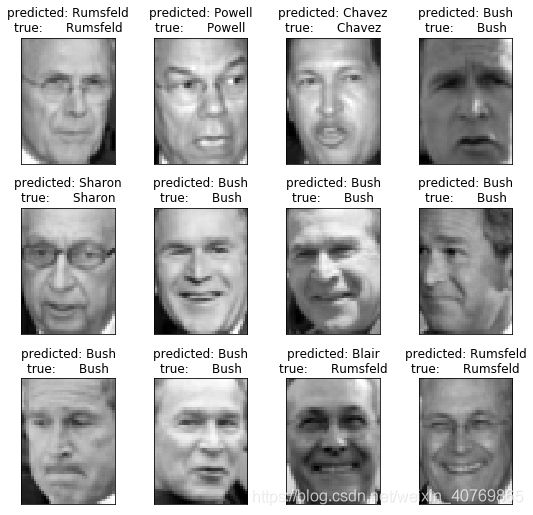
# Qualitative evaluation of the predictions using matplotlib

def plot_gallery(images, titles, h, w, n_row=3, n_col=4):
    """Helper function to plot a gallery of portraits"""
    plt.figure(figsize=(1.8 * n_col, 2.4 * n_row))
    plt.subplots_adjust(bottom=0, left=.01, right=.99, top=.90, hspace=.35)
    for i in range(n_row * n_col):
        plt.subplot(n_row, n_col, i + 1)
        plt.imshow(images[i].reshape((h, w)), cmap=plt.cm.gray)
        plt.title(titles[i], size=12)
        plt.xticks(())
        plt.yticks(())


# plot the result of the prediction on a portion of the test set

def title(y_pred, y_test, target_names, i):
    pred_name = target_names[y_pred[i]].rsplit(' ', 1)[-1]
    true_name = target_names[y_test[i]].rsplit(' ', 1)[-1]
    return 'predicted: %s\ntrue:      %s' % (pred_name, true_name)

prediction_titles = [title(y_pred, y_test, target_names, i)
                     for i in range(y_pred.shape[0])]

plot_gallery(X_test, prediction_titles, h, w)

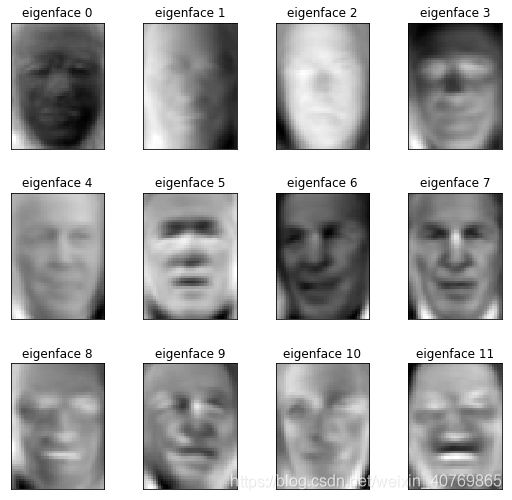
# plot the gallery of the most significative eigenfaces

eigenface_titles = ["eigenface %d" % i for i in range(eigenfaces.shape[0])]
plot_gallery(eigenfaces, eigenface_titles, h, w)

plt.show()
原始代码报错:
1.
File “D:/Software/Anaconda/envs/learn/untitled4.py”, line 14, in
from sklearn.cross_validation import train_test_split
ModuleNotFoundError: No module named ‘sklearn.cross_validation’
修改为:
from sklearn.model_selection import train_test_split
File “D:/Software/Anaconda/envs/learn/untitled4.py”, line 16, in
from sklearn.grid_search import GridSearchCV
ModuleNotFoundError: No module named ‘sklearn.grid_search’
修改为:
from sklearn.model_selection import GridSearchCV
File “D:/Software/Anaconda/envs/learn/untitled4.py”, line 19, in
from sklearn.decomposition import RandomizedPCA
ImportError: cannot import name ‘RandomizedPCA’ from ‘sklearn.decomposition’ (D:\Software\Anaconda\lib\site-packages\sklearn\decomposition_init_.py)
修改为:
from sklearn.decomposition import PCA
File “D:/Software/Anaconda/envs/learn/untitled4.py”, line 69, in
pca = RandomizedPCA(n_components=n_components, whiten=True).fit(X_train)
NameError: name ‘RandomizedPCA’ is not defined
修改为:
pca = PCA(n_components=n_components, whiten=True).fit(X_train)
File “D:\Software\Anaconda\lib\site-packages\sklearn\utils\class_weight.py”, line 62, in compute_class_weight
" got: %r" % class_weight)
ValueError: class_weight must be dict, ‘balanced’, or None, got: ‘auto’
修改为:
第88行: clf = GridSearchCV(SVC(kernel=‘rbf’, class_weight=’’), param_grid)
全部修改完成,运行结果(python3.7版本运行):
Created on Sun Jul 21 13:18:03 2019

@author: kechao

Total dataset size:
n_samples: 1288
n_features: 1850
n_classes: 7
Extracting the top 150 eigenfaces from 966 faces
done in 0.114s
Projecting the input data on the eigenfaces orthonormal basis
done in 0.018s
Fitting the classifier to the training set
D:\Software\Anaconda\lib\site-packages\sklearn\model_selection\_split.py:2053: FutureWarning: You should specify a value for 'cv' instead of relying on the default value. The default value will change from 3 to 5 in version 0.22.
  warnings.warn(CV_WARNING, FutureWarning)
done in 26.113s
Best estimator found by grid search:
SVC(C=1000.0, cache_size=200, class_weight='', coef0=0.0,
  decision_function_shape='ovr', degree=3, gamma=0.005, kernel='rbf',
  max_iter=-1, probability=False, random_state=None, shrinking=True,
  tol=0.001, verbose=False)
Predicting people's names on the test set
done in 0.062s
                   precision    recall  f1-score   support

     Ariel Sharon       1.00      0.70      0.82        23
     Colin Powell       0.81      0.83      0.82        60
  Donald Rumsfeld       0.95      0.65      0.77        31
    George W Bush       0.84      0.97      0.90       143
Gerhard Schroeder       0.96      0.82      0.88        28
      Hugo Chavez       1.00      0.78      0.88        18
       Tony Blair       0.70      0.74      0.72        19

        micro avg       0.85      0.85      0.85       322
        macro avg       0.89      0.78      0.83       322
     weighted avg       0.87      0.85      0.85       322

[[ 16   2   0   5   0   0   0]
 [  0  50   1   9   0   0   0]
 [  0   2  20   5   1   0   3]
 [  0   4   0 138   0   0   1]
 [  0   1   0   3  23   0   1]
 [  0   1   0   2   0  14   1]
 [  0   2   0   3   0   0  14]]
修改之后代码
如果对于上述修改部分有问题,推荐通过Beyond Compare软件比较上面代码和下面代码。
#from __future__ import print_function

from time import time
import logging
import matplotlib.pyplot as plt

from sklearn.model_selection  import train_test_split
from sklearn.datasets import fetch_lfw_people
from sklearn.model_selection  import GridSearchCV
from sklearn.metrics import classification_report
from sklearn.metrics import confusion_matrix
from sklearn.decomposition import PCA
from sklearn.svm import SVC


print(__doc__)

# Display progress logs on stdout
logging.basicConfig(level=logging.INFO, format='%(asctime)s %(message)s')


###############################################################################
# Download the data, if not already on disk and load it as numpy arrays

lfw_people = fetch_lfw_people(min_faces_per_person=70, resize=0.4)

# introspect the images arrays to find the shapes (for plotting)
n_samples, h, w = lfw_people.images.shape

# for machine learning we use the 2 data directly (as relative pixel
# positions info is ignored by this model)
X = lfw_people.data
n_features = X.shape[1]

# the label to predict is the id of the person
y = lfw_people.target
target_names = lfw_people.target_names
n_classes = target_names.shape[0]

print("Total dataset size:")
print("n_samples: %d" % n_samples)
print("n_features: %d" % n_features)
print("n_classes: %d" % n_classes)


###############################################################################
# Split into a training set and a test set using a stratified k fold

# split into a training and testing set
X_train, X_test, y_train, y_test = train_test_split(
    X, y, test_size=0.25)


###############################################################################
# Compute a PCA (eigenfaces) on the face dataset (treated as unlabeled
# dataset): unsupervised feature extraction / dimensionality reduction
n_components = 150

print("Extracting the top %d eigenfaces from %d faces"
      % (n_components, X_train.shape[0]))
t0 = time()
pca = PCA(n_components=n_components, whiten=True).fit(X_train)
print("done in %0.3fs" % (time() - t0))

eigenfaces = pca.components_.reshape((n_components, h, w))

print("Projecting the input data on the eigenfaces orthonormal basis")
t0 = time()
X_train_pca = pca.transform(X_train)
X_test_pca = pca.transform(X_test)
print("done in %0.3fs" % (time() - t0))


###############################################################################
# Train a SVM classification model

print("Fitting the classifier to the training set")
t0 = time()
param_grid = {'C': [1e3, 5e3, 1e4, 5e4, 1e5],
              'gamma': [0.0001, 0.0005, 0.001, 0.005, 0.01, 0.1], }
clf = GridSearchCV(SVC(kernel='rbf'), param_grid)
clf = clf.fit(X_train_pca, y_train)
print("done in %0.3fs" % (time() - t0))
print("Best estimator found by grid search:")
print(clf.best_estimator_)


###############################################################################
# Quantitative evaluation of the model quality on the test set

print("Predicting people's names on the test set")
t0 = time()
y_pred = clf.predict(X_test_pca)
print("done in %0.3fs" % (time() - t0))

print(classification_report(y_test, y_pred, target_names=target_names))
print(confusion_matrix(y_test, y_pred, labels=range(n_classes)))


###############################################################################
# Qualitative evaluation of the predictions using matplotlib

def plot_gallery(images, titles, h, w, n_row=3, n_col=4):
    """Helper function to plot a gallery of portraits"""
    plt.figure(figsize=(1.8 * n_col, 2.4 * n_row))
    plt.subplots_adjust(bottom=0, left=.01, right=.99, top=.90, hspace=.35)
    for i in range(n_row * n_col):
        plt.subplot(n_row, n_col, i + 1)
        plt.imshow(images[i].reshape((h, w)), cmap=plt.cm.gray)
        plt.title(titles[i], size=12)
        plt.xticks(())
        plt.yticks(())


# plot the result of the prediction on a portion of the test set

def title(y_pred, y_test, target_names, i):
    pred_name = target_names[y_pred[i]].rsplit(' ', 1)[-1]
    true_name = target_names[y_test[i]].rsplit(' ', 1)[-1]
    return 'predicted: %s\ntrue:      %s' % (pred_name, true_name)

prediction_titles = [title(y_pred, y_test, target_names, i)
                     for i in range(y_pred.shape[0])]

plot_gallery(X_test, prediction_titles, h, w)

# plot the gallery of the most significative eigenfaces

eigenface_titles = ["eigenface %d" % i for i in range(eigenfaces.shape[0])]
plot_gallery(eigenfaces, eigenface_titles, h, w)

plt.show()
SVM算法原理 以及 核函数相关请见 周志华《机器学习》 P121
Thanks!

