EM(Expectation Maximization 期望最大化)算法和GMM算法
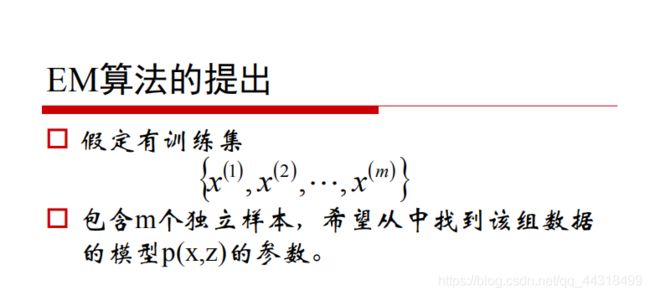
EM(Expectation Maximization 期望最大化)
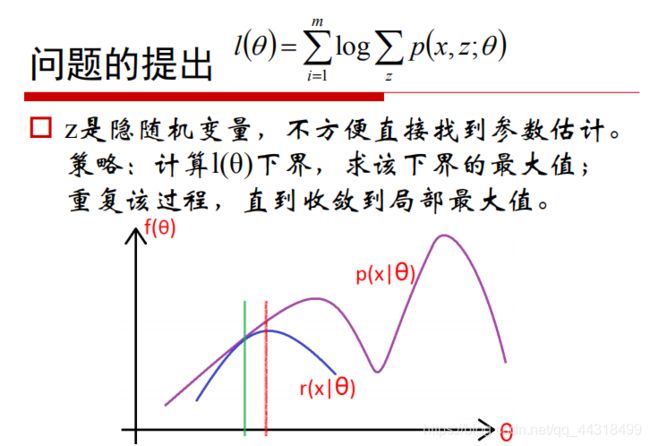
是一种迭代算法,用于含有隐变量的概率模型参数的极大似然估计,或极大后验概率估计。其每次迭代由E、M两步构成。


EM算法是在概率模型中寻找参数最大似然估计或者最大后验估计的算法,其中概率模型依赖于无法观测的隐含变量。
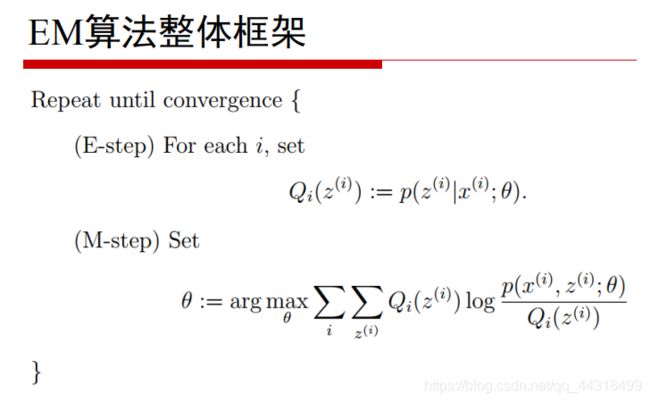
它经过两个步骤交替进行计算:
计算期望(E步),基于现有的模型参数(或者随机初始化的模型)对隐含变量的值进行猜测(估计),利用隐含变量现有的估计值,计算其最大似然的估计值。
最大化(M步),最大化在E步上求得的最大似然值来计算参数的值。M步上找到的参数估计值被用于下一个E步计算中,这个过程不断交替进行。


EM算法
EM算法
EM算法
EM算法
GMM算法 GaussianMixture
GMM混合高斯模型的EM算法
# !/usr/bin/python
# -*- coding:utf-8 -*-

import numpy as np
from scipy.stats import multivariate_normal
from sklearn.mixture import GaussianMixture
from mpl_toolkits.mplot3d import Axes3D
import matplotlib as mpl
import matplotlib.pyplot as plt
from sklearn.metrics.pairwise import pairwise_distances_argmin

mpl.rcParams['font.sans-serif'] = [u'SimHei']
mpl.rcParams['axes.unicode_minus'] = False

if __name__ == '__main__':
    style = 'myself'

    np.random.seed(0)
    mu1_fact = (0, 0, 0)
    cov1_fact = np.diag((1, 2, 3))
    data1 = np.random.multivariate_normal(mu1_fact, cov1_fact, 400)
    mu2_fact = (2, 2, 1)
    cov2_fact = np.array(((1, 1, 3), (1, 2, 1), (0, 0, 1)))
    data2 = np.random.multivariate_normal(mu2_fact, cov2_fact, 100)
    data = np.vstack((data1, data2))
    y = np.array([True] * 400 + [False] * 100)

    if style == 'sklearn':
        g = GaussianMixture(n_components=2, covariance_type='full', tol=1e-6, max_iter=1000)
        g.fit(data)
        print('类别概率:\t', g.weights_[0])
        print('均值:\n', g.means_, '\n')
        print('方差:\n', g.covariances_, '\n')
        mu1, mu2 = g.means_
        sigma1, sigma2 = g.covariances_
    else:
        num_iter = 100
        n, d = data.shape
        # 随机指定
        # mu1 = np.random.standard_normal(d)
        # print mu1
        # mu2 = np.random.standard_normal(d)
        # print mu2
        mu1 = data.min(axis=0)
        mu2 = data.max(axis=0)
        sigma1 = np.identity(d)
        sigma2 = np.identity(d)
        pi = 0.5
        # EM
        for i in range(num_iter):
            # E Step
            norm1 = multivariate_normal(mu1, sigma1)
            norm2 = multivariate_normal(mu2, sigma2)
            tau1 = pi * norm1.pdf(data)
            tau2 = (1 - pi) * norm2.pdf(data)
            gamma = tau1 / (tau1 + tau2)

            # M Step
            mu1 = np.dot(gamma, data) / np.sum(gamma)
            mu2 = np.dot((1 - gamma), data) / np.sum((1 - gamma))
            sigma1 = np.dot(gamma * (data - mu1).T, data - mu1) / np.sum(gamma)
            sigma2 = np.dot((1 - gamma) * (data - mu2).T, data - mu2) / np.sum(1 - gamma)
            pi = np.sum(gamma) / n
            print(i, ":\t", mu1, mu2)
        print('类别概率:\t', pi)
        print('均值:\t', mu1, mu2)
        print('方差:\n', sigma1, '\n\n', sigma2, '\n')

    # 预测分类
    norm1 = multivariate_normal(mu1, sigma1)
    norm2 = multivariate_normal(mu2, sigma2)
    tau1 = norm1.pdf(data)
    tau2 = norm2.pdf(data)

    fig = plt.figure(figsize=(13, 7), facecolor='w')
    ax = fig.add_subplot(121, projection='3d')
    ax.scatter(data[:, 0], data[:, 1], data[:, 2], c='b', s=30, marker='o', depthshade=True)
    ax.set_xlabel('X')
    ax.set_ylabel('Y')
    ax.set_zlabel('Z')
    ax.set_title(u'原始数据', fontsize=18)
    ax = fig.add_subplot(122, projection='3d')
    order = pairwise_distances_argmin([mu1_fact, mu2_fact], [mu1, mu2], metric='euclidean')  # 求距离
    print(order)
    if order[0] == 0:
        c1 = tau1 > tau2
    else:
        c1 = tau1 < tau2
    c2 = ~c1
    acc = np.mean(y == c1)
    print(u'准确率:%.2f%%' % (100 * acc))
    ax.scatter(data[c1, 0], data[c1, 1], data[c1, 2], c='r', s=30, marker='o', depthshade=True)
    ax.scatter(data[c2, 0], data[c2, 1], data[c2, 2], c='g', s=30, marker='^', depthshade=True)
    ax.set_xlabel('X')
    ax.set_ylabel('Y')
    ax.set_zlabel('Z')
    ax.set_title(u'EM算法分类', fontsize=18)
    plt.suptitle(u'EM算法的实现', fontsize=21)
    plt.subplots_adjust(top=0.90)
    plt.tight_layout()
    plt.show()
# !/usr/bin/python
# -*- coding:utf-8 -*-

import numpy as np
from sklearn.mixture import GaussianMixture
from sklearn.model_selection import train_test_split
import matplotlib as mpl
import matplotlib.colors
import matplotlib.pyplot as plt
import pandas as pd

mpl.rcParams['font.sans-serif'] = [u'SimHei']
mpl.rcParams['axes.unicode_minus'] = False


# from matplotlib.font_manager import FontProperties
# font_set = FontProperties(fname=r"c:\windows\fonts\simsun.ttc", size=15)
# fontproperties=font_set


def expand(a, b):
    d = (b - a) * 0.05
    return a - d, b + d


def format_conver(y):
    cy = y.flatten().tolist()
    cy = pd.Series(cy)
    cy = pd.Categorical(cy).codes
    return cy


if __name__ == '__main__':
    data = np.loadtxt('HeightWeight.csv', dtype=np.float, delimiter=',', skiprows=1)
    print(data.shape)
    y, x = np.split(data, [1, ], axis=1)
    x, x_test, y, y_test = train_test_split(x, y, train_size=0.6, random_state=0)
    gmm = GaussianMixture(n_components=2, covariance_type='full', random_state=0)
    x_min = np.min(x, axis=0)
    x_max = np.max(x, axis=0)
    gmm.fit(x)
    print('均值 = \n', gmm.means_)
    print('方差 = \n', gmm.covariances_)
    y_hat = gmm.predict(x)
    y_test_hat = gmm.predict(x_test)
    change = (gmm.means_[0][0] > gmm.means_[1][0])
    if change:
        z = y_hat == 0
        y_hat[z] = 1
        y_hat[~z] = 0
        z = y_test_hat == 0
        y_test_hat[z] = 1
        y_test_hat[~z] = 0
    acc = np.mean(y_hat.ravel() == y.ravel())
    acc_test = np.mean(y_test_hat.ravel() == y_test.ravel())
    acc_str = u'训练集准确率:%.2f%%' % (acc * 100)
    acc_test_str = u'测试集准确率:%.2f%%' % (acc_test * 100)
    print(acc_str)
    print(acc_test_str)

    cm_light = mpl.colors.ListedColormap(['#FF8080', '#77E0A0'])
    cm_dark = mpl.colors.ListedColormap(['r', 'g'])
    x1_min, x1_max = x[:, 0].min(), x[:, 0].max()
    x2_min, x2_max = x[:, 1].min(), x[:, 1].max()
    x1_min, x1_max = expand(x1_min, x1_max)
    x2_min, x2_max = expand(x2_min, x2_max)
    x1, x2 = np.mgrid[x1_min:x1_max:500j, x2_min:x2_max:500j]
    grid_test = np.stack((x1.flat, x2.flat), axis=1)
    grid_hat = gmm.predict(grid_test)
    grid_hat = grid_hat.reshape(x1.shape)
    if change:
        z = grid_hat == 0
        grid_hat[z] = 1
        grid_hat[~z] = 0
    plt.figure(figsize=(9, 7), facecolor='w')
    plt.pcolormesh(x1, x2, grid_hat, cmap=cm_light)
    plt.scatter(x[:, 0], x[:, 1], s=50, c=format_conver(y), marker='o', cmap=cm_dark, edgecolors='k')
    plt.scatter(x_test[:, 0], x_test[:, 1], s=60, c=format_conver(y_test), marker='^', cmap=cm_dark, edgecolors='k')

    p = gmm.predict_proba(grid_test)
    print(p)
    p = p[:, 0].reshape(x1.shape)
    CS = plt.contour(x1, x2, p, levels=(0.1, 0.5, 0.8), colors=list('rgb'), linewidths=2)
    plt.clabel(CS, fontsize=15, fmt='%.1f', inline=True)
    ax1_min, ax1_max, ax2_min, ax2_max = plt.axis()
    xx = 0.9 * ax1_min + 0.1 * ax1_max
    yy = 0.1 * ax2_min + 0.9 * ax2_max
    plt.text(xx, yy, acc_str, fontsize=18)
    yy = 0.15 * ax2_min + 0.85 * ax2_max
    plt.text(xx, yy, acc_test_str, fontsize=18)
    plt.xlim((x1_min, x1_max))
    plt.ylim((x2_min, x2_max))
    plt.xlabel(u'身高(cm)', fontsize='large')
    plt.ylabel(u'体重(kg)', fontsize='large')
    plt.title(u'EM算法估算GMM的参数', fontsize=20)
    plt.grid()
    plt.show()
GMM算法
sklearn.mixture.GaussianMixture