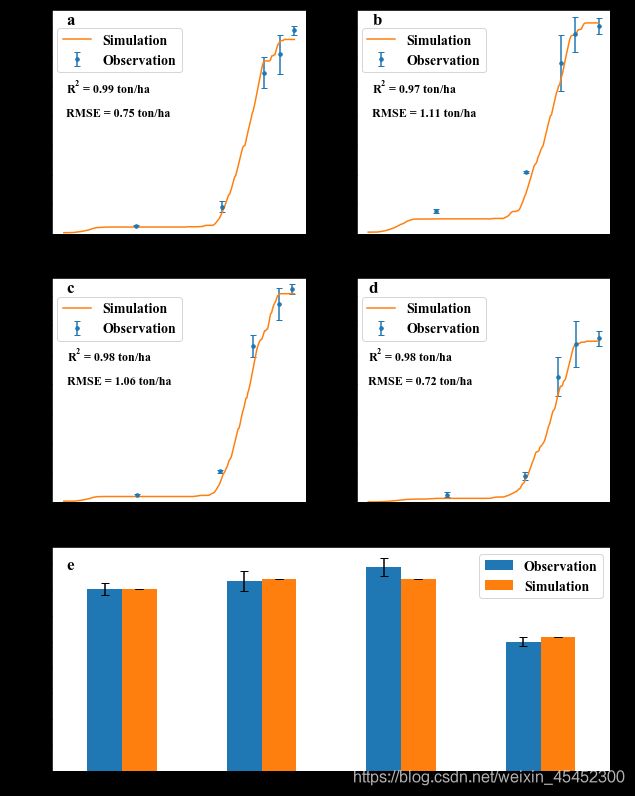
python 绘图,绘制模型模拟与实测值对比图
模型模拟值一般为连续的值,实测值为点,且一般带有误差
# 设置绘图地点
sites = ['内黄', '许昌', '洛宁', '罗山']
sites_e = ['NH', 'XC', 'LN', 'LS']
annote = ['a', 'b', 'c', 'd']
data_dir = r'C:\Users\Administrator\Desktop\model calibration'  # 模型校准文件夹
weather_dir = r'C:\Users\Administrator\Desktop\2020气象数据'  # 气象数据路径
variety = 207# 品种
data_obs = pd.read_excel('实测值.xlsx', sheet_name='实测值')  # 实测值
tagp_rmse = [] # bioass rmse
twso_sim = [] # yield simulation
twso = [] # yield observation
twso_std = [] # yield standard deviation
fig = plt.figure(figsize=(10,14)) # define figure
for i in range(4): # 循环画每个地点
    site = sites[i]
    cropdata = CABOFileReader(os.path.join(data_dir,'%s.CAB'%site))  # 读取作物文件
    soildata = CABOFileReader(os.path.join(data_dir,'EC3.NEW'))  # 土壤文件
    sitedata = {
     'SSMAX'  : 0.,
                'IFUNRN' : 0,
                'NOTINF' : 0,
                'SSI'    : 0,
                'WAV'    : 20,
                'SMLIM'  : 0.03,
               'RDMSOL'  : 120}
    parameters = ParameterProvider(cropdata=cropdata, soildata=soildata, sitedata=sitedata)  # 参数集合
    data_base_info = pd.read_excel('18县生物量LAI整理12.27.xlsx', sheet_name='基本情况')
    sub_data = data_base_info.loc[data_base_info['试验地']==site,
                                  ['经度', '维度', '品种', '播量(计算)', '播种期',
                                   'sa', 'cl', 'bd', 'som', '灌溉', 'WAV']]
    # 基本数据获取
    lon = sub_data.loc[sub_data['品种']==variety, ['经度']]  # 读取经度
    lat = sub_data.loc[sub_data['品种']==variety, ['维度']]  # 读取纬度
    SAND = sub_data.loc[sub_data['品种']==variety, ['sa']].iloc[0,0]  # 砂粒
    CLAY = sub_data.loc[sub_data['品种']==variety, ['cl']].iloc[0,0]  # 黏粒
    OM = sub_data.loc[sub_data['品种']==variety, ['som']].iloc[0,0]  # 有机质
    BULK_DENSITY = sub_data.loc[sub_data['品种']==variety, ['bd']].iloc[0,0]  # 容重

    # 数据替换
    parameters['TDWI'] = sub_data.loc[sub_data['品种']==variety, ['播量(计算)']].iloc[0,0]  # 播量
    parameters['SMW'] = soil_data(SAND, CLAY, OM, BULK_DENSITY)[0]  # 萎蔫点
    parameters['SMFCF'] = soil_data(SAND, CLAY, OM, BULK_DENSITY)[1]  # 田间持水量
    parameters['SM0'] = soil_data(SAND, CLAY, OM, BULK_DENSITY)[2]  # 饱和含水量
    parameters['WAV'] = sub_data.loc[sub_data['品种']==variety, ['WAV']].iloc[0,0]
    # 气象数据
    weatherdataprovider = ExcelWeatherDataProvider(os.path.join(weather_dir,'NASA天气文件lat={0:.1f},lon={1:.1f}.xlsx'.
                                                                format(st_loc(lat.iloc[0,0]), st_loc(lon.iloc[0,0]))))
    agromanagement = YAMLAgroManagementReader(os.path.join(data_dir,'%s.agro'%site))  # 管理文件读取

    wf = Wofost71_WLP_FD(parameters, weatherdataprovider, agromanagement)  # 定义模型
    wf.run_till_terminate()  # 运行模型直到终止
    output=pd.DataFrame(wf.get_output()).set_index('day')
    # 实测值
    sub_obs = data_obs.loc[data_obs['试验地']==site, ['品种', 'day', 'LAI', '生物量kg/ha',
                                                   '穗生物量kg/ha', '生物量标准差', '穗标准差']]
    sub_obs_103 = sub_obs.loc[sub_obs['品种']==variety].set_index('day')
    axes = fig.add_subplot(3,2,i+1)
    sub_obs_103['生物量kg/ha'] = sub_obs_103['生物量kg/ha']/1000
    sub_obs_103['穗生物量kg/ha'] = sub_obs_103['穗生物量kg/ha']/1000
    sub_obs_103['生物量标准差'] = sub_obs_103['生物量标准差']/1000
    # ------------开始绘图---------------
    axes.errorbar(sub_obs_103.index, sub_obs_103['生物量kg/ha'], yerr=sub_obs_103['生物量标准差'], fmt=".", ms=7,capsize=3, label = 'Observation') # 带误差棒的点,实测值
    output['TAGP'] = output['TAGP']/1000 # 换算为ton
    output['TWSO'] = output['TWSO']/1000
    output.TAGP.plot(ax=axes, label = 'Simulation') # 绘制模拟曲线
    output['TAGP'].dropna(inplace=True)
    output['TWSO'].dropna(inplace=True)
    df_differences_tagp = sub_obs_103['生物量kg/ha'] - output['TAGP']
    tagp_rmse.append(np.sqrt(np.mean(df_differences_tagp**2))) # 计算rmse
    # yield obs
    twso.append(sub_obs_103['穗生物量kg/ha'][-1])
    # yield sim
    twso_sim.append(output['TWSO'][-1])
    twso_std.append(sub_obs_103['穗标准差'][-1]/1000)
    r2 = 1 - np.sum((df_differences_tagp)**2) / np.sum((sub_obs_103['生物量kg/ha'] - np.mean(sub_obs_103['生物量kg/ha']))**2) # 计算R2
    # 定义字体
    font = {
     'family' : 'Times New Roman',
    'weight' : 'normal',
    'size'   : 14,
    }
    axes.set_xlabel('') # xlabel font 去掉xlabel
    axes.set_ylabel('Biomass (ton/ha)', font)
    axes.annotate("RMSE = %.2f ton/ha" % tagp_rmse[i], xy=('2019-10-20', 10),  family='Times New Roman', weight='normal', fontsize=12)
    plt.text('2019-10-20', 17.8, annote[i], family='Times New Roman', weight='normal', fontsize=17) # 两种标识方法
    axes.annotate("$\mathregular{R^2}$ = %.2f ton/ha" % r2, xy=('2019-10-20', 12),  family='Times New Roman', weight='normal', fontsize=12)
    # 设置坐标轴字体格式
    plt.tick_params(labelsize=12)
    plt.xticks(fontproperties = 'Times New Roman' ,size = 12,rotation = 30)
    #
    labels = axes.get_xticklabels() + axes.get_yticklabels()
    [label.set_fontname('Times New Roman') for label in labels]

    plt.ylim(0, 19) # 设置y范围
    plt.legend(fontsize = 14, loc=(0.02, 0.72), prop=font)
axes = fig.add_subplot(3,1,3) # 绘制第三行大图
df = pd.DataFrame({
     'Observation': twso, 'Simulation': twso_sim}) # 数据
df.plot(kind='bar', ax=axes,  yerr = [twso_std, [0,0,0,0]], error_kw = {
     'capsize' :4}, alpha=1)
plt.xticks([0,1,2,3],sites_e,fontproperties = 'Times New Roman' ,size = 12,rotation = 0)
axes.set_ylabel('Yield (ton/ha)', font)
plt.text(-0.4, 7.8, 'e', family='Times New Roman', weight='normal', fontsize=17)
labels = axes.get_xticklabels() + axes.get_yticklabels()
[label.set_fontname('Times New Roman') for label in labels]
plt.tick_params(labelsize=12)
plt.legend(prop=font)
# plt.tight_layout()
plt.savefig('simulation.jpg', dpi=600)
