2.11生成可控的随机数据集合
2.11 生成可控的随机数据集合
1、首先我们需要了解一些术语
(1)分布或者概率分布:表示统计实验的结果和发生概率之间的联系。
(2)标准差:这个数值表示个体和群体之间的差异。如果差异很大,标准差会比较大;如果所有个体实验在整组范围内基本相同,标准差会比较小。
(3)方差:标准差的平方
(4)总体或者统计总体(Population or statisticalpopulation):所有潜在的可观测案例的集合
(5)样本:这是总体的子集
2、用Python的random模块生成一个简单的随机样本数据
import pylab
import random

SAMPLE_SIZE = 100
"""
种子随机发生器
如果没有提供参数
使用系统当前时间
"""
random.seed()

# 在此处存储生成的随机值

real_rand_vars = []

# 我们不需要迭代器值,我们把它叫做‘—’
for _ in range(SAMPLE_SIZE):
    # 获取下一个随机值
    new_value = random.random()
    real_rand_vars.append(new_value)

# 从10个桶中的数据创建直方图
pylab.hist(real_rand_vars, 10)

# 定义x和y标签
pylab.xlabel("Number Range")
pylab.ylabel("Count")

pylab.show()
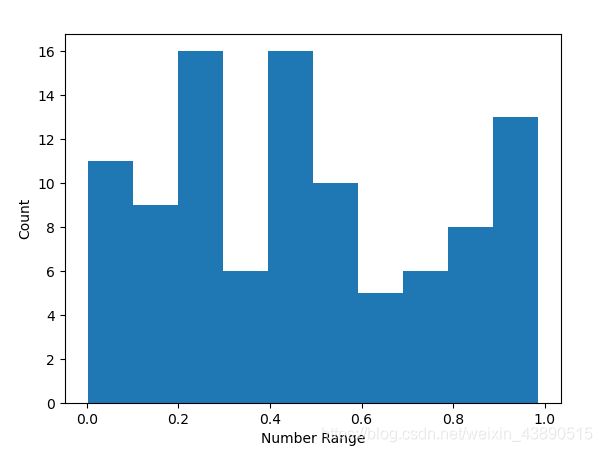
这是一个均匀分布的数据样本,可以运行看到如下图:

可以用random.randint(min, max)。这里的 min 和 max 指相应的下限和上限。如果想生成浮点数而不是整数的样本,可以用random.uniform(min, max)方法
3、生成虚拟价格增长数据的时序图,并加上一些随机噪声
代码实现如下:
"""
生成虚拟价格增长数据的时序图,并加上一些随机噪声
"""
import pylab
import random

# 生成数据的天数
duration = 100
# 平均值
mean_inc = 0.2
# standard deviation(标准差)
std_dev_inc = 1.2
# time series(时间序列)
x=range(duration)
y=[]
price_today=0

for i in x:
    next_delta=random.normalvariate(mean_inc,std_dev_inc)
    price_today+=next_delta
    y.append(price_today)

pylab.plot(x,y)
pylab.xlabel("Time")
pylab.ylabel("Value")
pylab.show()
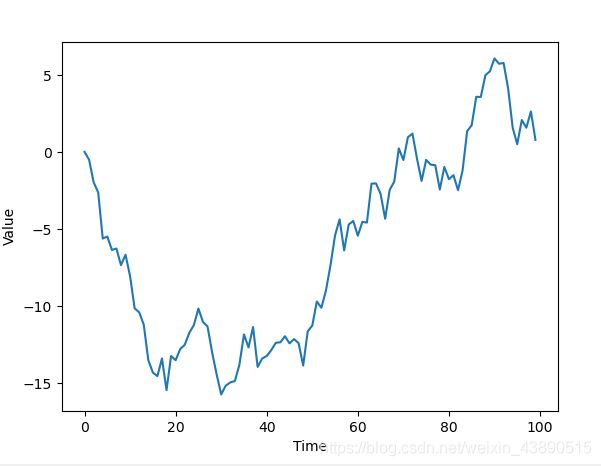
这段代码定义了100个数据点(虚拟天数)的序列。
对于接下来的每一天,从中值为mean_inc,标准差为std_dev_inc的正态分布(random.normalvariate())中选取一个随机值,然后加上前一天的价格(price_today)作为当天的价格。
4、如果想要更多的控制,可以使用不同的分布。下面的代码说明并展示了不同的分布。
代码实现如下:
import random
import matplotlib
import matplotlib.pyplot as plt

SAMPLE_SIZE = 1000

# 直方图
buckets = 10
plt.figure()

# 我们需要为这个例子更新字体大小
matplotlib.rcParams.update({
     'font.size': 7})
plt.subplot(621)
plt.xlabel('random.random')

# 返回[0.0,1.0]范围内的下一个随机浮点数。
res = []
for _ in range(1, SAMPLE_SIZE):
    res.append(random.random())
plt.hist(res, buckets)

plt.subplot(622)
plt.xlabel('random.uniform')

# 返回一个随机浮点数N,使a<=N<=b表示a<=b,b<=N<=a表示b
# 根据等式a+(b-a)*random()中的浮点舍入,端点值b可以包括在范围内,也可以不包括在范围内
a = 1
b = SAMPLE_SIZE
res = []
for _ in range(1, SAMPLE_SIZE):
    res.append(random.uniform(a, b))

plt.hist(res, buckets)

plt.subplot(623)
plt.xlabel("random.triangular")
"""
返回一个随机浮点数N,使low<=N<=high,并且指定的模式位于这些界限之间。
下限和上限默认为0和1。mode参数默认为边界之间的中点,提供对称分布。
"""
low = 1
high = SAMPLE_SIZE
res = []
for _ in range(1, SAMPLE_SIZE):
    res.append(random.triangular(low, high))
plt.hist(res, buckets)

plt.subplot(624)
plt.xlabel("random.betavariate")
# β分布。参数的条件是alpha>0和beta>0。返回值的范围介于0和1之间
alpha = 1
beta = 10
res = []
for _ in range(1,SAMPLE_SIZE):
    res.append(random.betavariate(alpha,beta))

plt.hist(res,buckets)


plt.subplot(625)
plt.xlabel("random.expovariate")
"""
指数分布。lambd为1.0除以所需平均值。它应该是非零的。
(参数将被称为“lambda”,但在Python中这是一个保留字。)
如果lambd为正,则返回值的范围是从0到正无穷大;
如果lambd为负,则返回值的范围是从负无穷大到0
"""
lambd=1.0/((SAMPLE_SIZE+1)/2.)
res=[]
for _ in range(1,SAMPLE_SIZE):
    res.append(random.expovariate(lambd))

plt.hist(res,buckets)

plt.subplot(626)
plt.xlabel("random.gammavariate")
"""
伽马分布。(不是gamma函数!)参数的条件是alpha>0和beta>0。
概率分布函数为:
          x ** (alpha - 1) * math.exp(-x / beta)
 pdf(x) =  --------------------------------------
             math.gamma(alpha) * beta ** alpha
"""
alpha = 1
beta = 10
res = []
for _ in range(1,SAMPLE_SIZE):
    res.append(random.gammavariate(alpha,beta))
plt.hist(res,buckets)

plt.subplot(627)
plt.xlabel("random.lognormvariate")
"""
对数正态分布。如果你取这个分布的自然对数,你会得到一个正态分布,
平均μ和标准偏差σ。mu可以有任何值,sigma必须大于零。
"""
mu = 1
sigma = 0.5
res = []
for _ in range(1,SAMPLE_SIZE):
    res.append(random.lognormvariate(mu,sigma))
plt.hist(res,buckets)


plt.subplot(628)
plt.xlabel("random.normalvariate")
"""
正态分布。mu是平均值,sigma是标准差。
"""
mu = 1
sigma = 0.5
res=[]
for _ in range(1,SAMPLE_SIZE):
    res.append(random.normalvariate(mu,sigma))
plt.hist(res,buckets)


plt.subplot(629)
plt.xlabel("random.paretovariate")
"""
帕累托分布。alpha是形状参数。
"""
alpha = 1
res = []
for _ in range(1,SAMPLE_SIZE):
    res.append(random.paretovariate(alpha))
plt.hist(res,buckets)
plt.tight_layout()
plt.show()

