numpy, pandas 中 axis 概念和运算过程解析
numpy 中有一个 axis 概念,多维数组运算时,我们常被 axis 弄晕!
本文尝试在2维平面的表格中解析 numpy 4-d array 的运算过程。
在 numpy, pandas 中,很多函数,尤其是一些描述统计函数都有一个 axis 参数。axis参数的不同,会得到不同的运算结果。
pandas中的axis来源于 numpy, 两者的含义和规则是一样的。
所以我们理解了 numpy 的 axis,对 pandas 中的 axis 参数的理解会很容易。
NumPy
NumPy 中最核心的数据结构就是 ndarray,多维数组,它是数组 array 的多维容器。
ndarray
NumPy provides an N-dimensional array type, the ndarray, which describes a collection of “items” of the same type. The items can be indexed using for example N integers.
这是官方的对 ndarray 的描述性定义。请注意:
- ndarray, 是 N-dimensional array 的缩写;
- ndarray,是一个 collection,牛津词典对 collection 的解释是 a group of objects, often of the same sort, that have been collected。一组对象,同类,已经被收集在一起。
- “items”,用 items 表示同类的对象,而不是 elements,所以后面有
subarray的概念,并且很重要。
对于 ndarray(含subarray)来说,同类不仅是 dtype 相同,还包括 shape 相同。
The N-dimensional array (ndarray)(https://numpy.org/doc/stable/reference/arrays.ndarray.html#the-n-dimensional-array-ndarray)
An ndarray is a (usually fixed-size) multidimensional container of items of the same type and size. The number of dimensions and items in an array is defined by its shape, which is a tuple of N non-negative integers that specify the sizes of each dimension. The type of items in the array is specified by a separate data-type object (dtype), one of which is associated with each ndarray.
ndarray有三个最重要的属性。
-
ndarray.ndim, 返回 array 的维数 ( axes 数)。 -
ndarray.shape, array 的维数。返回的是一个整数元组,表示每个维度中 array 的大小。对于一个有 n 行 m 列的矩阵,形状是(n,m)。因此,shape元组的长度是 axes 数、ndim。 -
ndarray.size, 数组中元素的总数。等于形状元素的乘积。
subarray data type
A structured data type may contain a ndarray with its own dtype and shape。
请注意这里的 shape。
NumPy 中的函数运算方法
官方文档在 Beyond the Basics 部分讨论了 NumPy 中函数运算的四个层次。
Beyond the Basics
- Iterating over elements in the array
- Basic Iteration
- Iterating over all but one axis
- Iterating over multiple arrays
- Broadcasting over multiple arrays
虽然运算最终要归结到每个 element 上,但不同的顺序效率会不同。
在 Iterating over all but one axis 部分讨论了 over axis 的迭代运算是如何节省时间的:
Iterating over all but one axis
A common algorithm is to loop over all elements of an array and perform some function with each element by issuing a function call.
As function calls can be time consuming, one way to speed up this kind of algorithm is to write the function so it takes a vector of data and then write the iteration so the function call is performed for an entire dimension of data at a time.
This increases the amount of work done per function call, thereby reducing the function-call over-head to a small(er) fraction of the total time.
Even if the interior of the loop is performed without a function call it can be advantageous to perform the inner loop over the dimension with the highest number of elements to take advantage of speed enhancements available on micro- processors that use pipelining to enhance fundamental operations.
从上面的描述中,显然是先调用 subarray, axis,…等矢量(vector),再在 vector 的内部执行 element 级运算,节省计算的总时间,效率更高。
NumPy 的大多数函数运算,选择方法的顺序如下:
- over multiple arrays (subarray),
- Basic Iteration
- Iterating over all but one axis
NumPy 的 axis
Universal functions (ufunc)
中 ufunc, Optional keyword arguments 部分对 axis 的概念做了解释。
axes
A list of tuples with indices of axes a generalized ufunc should operate on. For instance, for a signature of appropriate for matrix multiplication, the base elements are two-dimensional matrices and these are taken to be stored in the two last axes of each argument. The corresponding axes keyword would be . For simplicity, for generalized ufuncs that operate on 1-dimensional arrays (vectors), a single integer is accepted instead of a single-element tuple, and for generalized ufuncs for which all outputs are scalars, the output tuples can be omitted.
(i,j),(j,k)->(i,k)``[(-2, -1), (-2, -1), (-2, -1)]
axis
A single axis over which a generalized ufunc should operate. This is a short-cut for ufuncs that operate over a single, shared core dimension, equivalent to passing in with entries of for each single-core-dimension argument and for all others. For instance, for a signature , it is equivalent to passing in .
axes``(axis,)``()``(i),(i)->()``axes=[(axis,), (axis,), ()]
下面我将用示例和图示来说明我对 axis 的理解,以及如何记忆并准确使用 axis 参数。
ndarray 演示
我们用一个4维 array 来演示。建议不要用2维的,容易产生误导。
并且建议淡忘“行”,“列”的概念, 多用“纵向”,“横向”的概念。
import numpy as np
import pandas as pd
nd4 = np.arange(72).reshape(3,2,4,3)
nd4
array([[[[ 0,  1,  2],
         [ 3,  4,  5],
         [ 6,  7,  8],
         [ 9, 10, 11]],

        [[12, 13, 14],
         [15, 16, 17],
         [18, 19, 20],
         [21, 22, 23]]],


       [[[24, 25, 26],
         [27, 28, 29],
         [30, 31, 32],
         [33, 34, 35]],

        [[36, 37, 38],
         [39, 40, 41],
         [42, 43, 44],
         [45, 46, 47]]],


       [[[48, 49, 50],
         [51, 52, 53],
         [54, 55, 56],
         [57, 58, 59]],

        [[60, 61, 62],
         [63, 64, 65],
         [66, 67, 68],
         [69, 70, 71]]]])
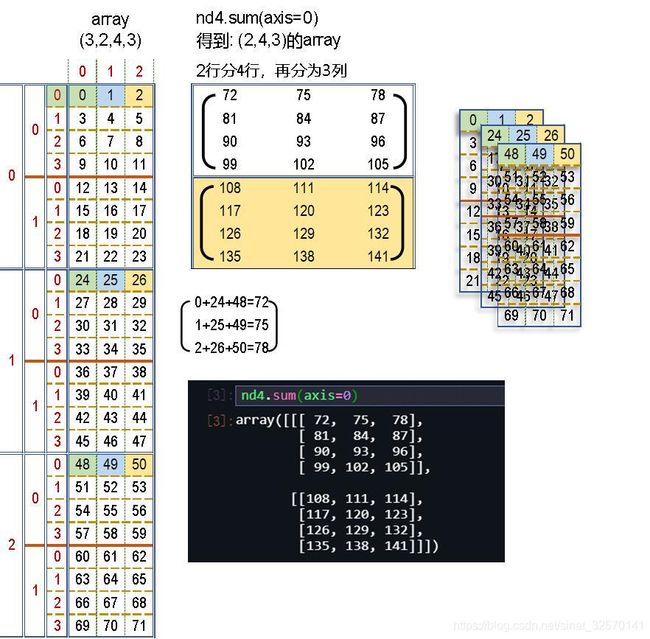
我们创建了一个 4 维的 array。在平面上如何理解这个4维数组呢?
请看下图:
规则:
- axis 本质是一个 vector,它有方向(箭头的方向)和长度(箭头的长度);
- 整个 array 就是一个数据空间,“数据空间”可以被划分为子空间(subarray);
- 空间可以再分层,用 axis=0,axis=1, axis=2, …,标识层;
- axis=0是最外层,本例中,aixs=0 层被划分为3个 subarray (子空间),subarray[0],subarray[1],subarray[2],它们之间是平行的;
- axis=1 是 axis=0 的内层,…依此类推;
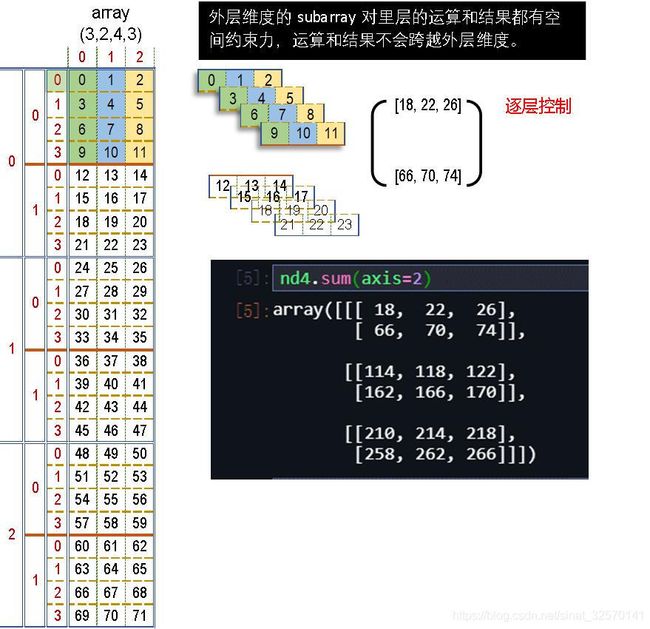
- 外层的 subarray 是内层的数据空间,运算受“数据空间”的约束,“凡人不能穿越时空”;
- 本例中,在 axis=1维度上,外面一层的每个 subarray 在该层都被划分为2个子空间(subarray[0][0], subarray[0][1]) …共有 3*2 =6个 sub_subarray, 依此类推;
- 外层的subarray对里层的运算具有空间约束力,里层的运算不会跨越外层 subarray 的空间,约束逐层控制;
- 运算先整体读取 subarray,再在 subarray 里进行循环,最后进行 elements 的运算,以节省运算的总时间。"
axis=0
这是万物的起点,也是万物的终点。它是最外一层“数据空间”。
-
整个数据空间在 axis=0 (向下) 方向上被划分为 3 个子空间,即在 axis=0 维度(空间上)有3个 subarray ;
-
3个 subarray 的类型相同,都是是 shape = (2,4, 3) 的 array;
-
在 axis=0 维度上,item = subarray;
-
axis=0 上的橘色箭头是一个矢量,它的长度为3,方向向下,表示 axis=0 维度(空间层次)。
-
带 axis = 0 参数的运算,总是基于 这3个subarray, 在向下的方向上进行(over the axis);
-
运算时,先整体读取这 3 个 subarray,就像3个 subarray 片叠加对齐,再在 subarray 的内部进行 element 运算;
axis = 1
- axis=1 的数据空间在纵向(向下) 方向上被划分为 2 个子空间,即在 axis=1 维度上有 2 个 subarray;
- axis=0 的 subarray 是 axis=1 维度的宇宙(本例中有有3个平行小宇宙),凡人是不能穿越的,运算一般不能跨上一个维度的subarray。
nd4.sum(axis=2)
array([[[ 18,  22,  26],
        [ 66,  70,  74]],

       [[114, 118, 122],
        [162, 166, 170]],

       [[210, 214, 218],
        [258, 262, 266]]])
# subarray 整体提取

nd4[2]
array([[[48, 49, 50],
        [51, 52, 53],
        [54, 55, 56],
        [57, 58, 59]],

       [[60, 61, 62],
        [63, 64, 65],
        [66, 67, 68],
        [69, 70, 71]]])
# subarray 整体删除

np.delete(nd4, 1, axis=1)
array([[[[ 0,  1,  2],
         [ 3,  4,  5],
         [ 6,  7,  8],
         [ 9, 10, 11]]],


       [[[24, 25, 26],
         [27, 28, 29],
         [30, 31, 32],
         [33, 34, 35]]],


       [[[48, 49, 50],
         [51, 52, 53],
         [54, 55, 56],
         [57, 58, 59]]]])
pandas
Series, DataFrame 有很多计算描述统计和其它相关操作的函数。
其中的大多数是聚合(因此产生低维的结果),如 sum(), mean(), and quantile(), 但有些, 如 cumsum() 和 cumprod(), 产生相同大小的对象。
这些方法一般都带有一个 axis 参数, 就像 ndarray.{sum, std, …} 一样, 但是可以通过名称或整数指定 axis:
- Series: no axis argument needed
- DataFrame: “index” (axis=0, default), “columns” (axis=1)
numpy 关于 axis 的官方论述:https://numpy.org/doc/stable/user/c-info.beyond-basics.html?highlight=axis
以 DataFrame 为例
import numpy as np
import pandas as pd

ind = ['i1', 'i2', 'i3', 'i4', 'i5', 'i6', 'i7', 'i8', 'i9']
col = ['c1', 'c2', 'c3', 'c4', 'c5']
da = [[ 2., None, -5.,  5.,  4.],
       [ 4.,  2., None, -4.,  2.],
       [ 5.,  4.,  8., None, -8.],
       [ 8., -6.,  3., -5., None],
       [None,  7.,  0.,  9., -4.],
       [ 6., None, -8.,  8., -5.],
       [-3.,  6., None,  2., -8.],
       [ 5., -3., -8., None,  1.],
       [-7., -7., -7.,  9., None]]
df = pd.DataFrame(da, ind, col)
df
| c1 | c2 | c3 | c4 | c5 | |
|---|---|---|---|---|---|
| i1 | 2.0 | NaN | -5.0 | 5.0 | 4.0 |
| i2 | 4.0 | 2.0 | NaN | -4.0 | 2.0 |
| i3 | 5.0 | 4.0 | 8.0 | NaN | -8.0 |
| i4 | 8.0 | -6.0 | 3.0 | -5.0 | NaN |
| i5 | NaN | 7.0 | 0.0 | 9.0 | -4.0 |
| i6 | 6.0 | NaN | -8.0 | 8.0 | -5.0 |
| i7 | -3.0 | 6.0 | NaN | 2.0 | -8.0 |
| i8 | 5.0 | -3.0 | -8.0 | NaN | 1.0 |
| i9 | -7.0 | -7.0 | -7.0 | 9.0 | NaN |
理解pandas 的 axis
pandas 基于 numpy,两者的 axis 是一致的。
以 numpy 的 numpy.ndarray.sum 方法为例:
-
ndarray.sum(*axis=None*, *dtype=None*, *out=None*, *keepdims=False*, *initial=0*, *where=True*)Return the sum of the array elements over the given axis.
返回数组元素在给定轴上的和。
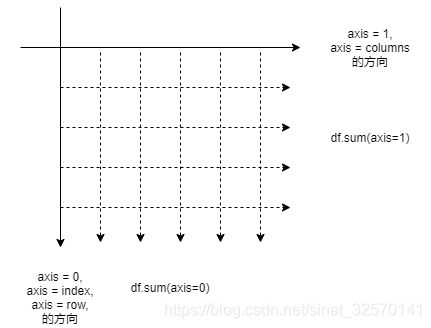
造成 axis 理解的困惑的主要原因是,在 pandas 中, axis =0, axis = 1有别名 row (index)和 columns,我们习惯地将其理解为行和列(因为 excel 表格的影响)。
如果将 axis 理解为 维度方向,官方文档中的上面那句话就没有歧义了:返回数组元素在给定 ‘方向’ 上的和。 index, columns仅是一个方向而已。
在 excel 中,常把垂直方向的求和称为“列求和(但又将得到的结果称之为“汇总行”)”,把水平方向的求和称为“行求和(又称之为“汇总列”)”,这可能是造成困惑的主要原因。
axis 本质是 line,直线的方向就是 pandas, numpy 函数作用的方向,沿着这条线的方向进行运算吧,有几条线就有几个结果值!!!
前面的例子中的 df,有5条方向为axis=0的直线,有9条方向为axis=1的直线!!!
以df.sum()为例
df.apply(np.mean,axis=1)
i1    1.50
i2    1.00
i3    2.25
i4    0.00
i5    3.00
i6    0.25
i7   -0.75
i8   -1.25
i9   -3.00
dtype: float64
# 生成汇总行,得到一行数据

df.sum(axis=0)
c1    20.0
c2     3.0
c3   -17.0
c4    24.0
c5   -18.0
dtype: float64
#生成汇总列, 得到一列数据,

df.sum(axis=1)
i1     6.0
i2     4.0
i3     9.0
i4     0.0
i5    12.0
i6     1.0
i7    -3.0
i8    -5.0
i9   -12.0
dtype: float64
# 提取 Series

type(df.loc['i1'])
pandas.core.series.Series
df.sum(axis=1)
i1     6.0
i2     4.0
i3     9.0
i4     0.0
i5    12.0
i6     1.0
i7    -3.0
i8    -5.0
i9   -12.0
dtype: float64
下表列出了 pandas 中的描述性统计函数,它们的用法与 sum()类似:
| Function | Description |
|---|---|
count |
Number of non-NA observations |
sum |
Sum of values |
mean |
Mean of values |
mad |
Mean absolute deviation |
median |
Arithmetic median of values |
min |
Minimum |
max |
Maximum |
mode |
Mode |
abs |
Absolute Value |
prod |
Product of values |
std |
Bessel-corrected sample standard deviation |
var |
Unbiased variance |
sem |
Standard error of the mean |
skew |
Sample skewness (3rd moment) |
kurt |
Sample kurtosis (4th moment) |
quantile |
Sample quantile (value at %) |
cumsum |
Cumulative sum |
cumprod |
Cumulative product |
cummax |
Cumulative maximum |
cummin |
Cumulative minimum |
pandas 中axis的困惑与解决
由于excel的影响,在思维直觉上,axis设置运算结果与后台算法存在差异,常给新手带来困惑。
stackoverflow上有专题讨论,大家可以参考:
https://stackoverflow.com/questions/25773245/ambiguity-in-pandas-dataframe-numpy-array-axis-definition
我的“笨办法”是:
axis=0表示行方向,函数运算的结果就是得到一新行,“汇总行”;axis=1表示列方向,函数运算的结果就是得到一新列,“汇总列”;- 对于
df.drop()函数, drop是删除,axis=0当然是删除行;axis=1当然是删除列; - 至于
df.apply(),与其中的fun参数一致。
DataFrame.drop()
pandas.DataFrame.drop
DataFrame.drop(labels=None, axis=0, index=None, columns=None, level=None, inplace=False, errors='raise')
df.drop(['c2'], axis=1)
| c1 | c3 | c4 | c5 | |
|---|---|---|---|---|
| i1 | 2.0 | -5.0 | 5.0 | 4.0 |
| i2 | 4.0 | NaN | -4.0 | 2.0 |
| i3 | 5.0 | 8.0 | NaN | -8.0 |
| i4 | 8.0 | 3.0 | -5.0 | NaN |
| i5 | NaN | 0.0 | 9.0 | -4.0 |
| i6 | 6.0 | -8.0 | 8.0 | -5.0 |
| i7 | -3.0 | NaN | 2.0 | -8.0 |
| i8 | 5.0 | -8.0 | NaN | 1.0 |
| i9 | -7.0 | -7.0 | 9.0 | NaN |
df.drop(['i3'], axis=0)
| c1 | c2 | c3 | c4 | c5 | |
|---|---|---|---|---|---|
| i1 | 2 | NaN | -5 | 5 | 4 |
| i2 | 4 | 2 | NaN | -4 | 2 |
| i4 | 8 | -6 | 3 | -5 | NaN |
| i5 | NaN | 7 | 0 | 9 | -4 |
| i6 | 6 | NaN | -8 | 8 | -5 |
| i7 | -3 | 6 | NaN | 2 | -8 |
| i8 | 5 | -3 | -8 | NaN | 1 |
| i9 | -7 | -7 | -7 | 9 | NaN |
DataFrame.apply()
df.apply(np.sum, axis=0)
c1    20.0
c2     3.0
c3   -17.0
c4    24.0
c5   -18.0
dtype: float64
df.apply(np.sum,axis=1)
i1     6.0
i2     4.0
i3     9.0
i4     0.0
i5    12.0
i6     1.0
i7    -3.0
i8    -5.0
i9   -12.0
dtype: float64
使用 apply print 检验
下面的示例,可以证明是先取 subarray,再执行元素运算的:
df.apply(lambda x:print(x), axis=0)
i1    2.0
i2    4.0
i3    5.0
i4    8.0
i5    NaN
i6    6.0
i7   -3.0
i8    5.0
i9   -7.0
Name: c1, dtype: float64
i1    NaN
i2    2.0
i3    4.0
i4   -6.0
i5    7.0
i6    NaN
i7    6.0
i8   -3.0
i9   -7.0
Name: c2, dtype: float64
i1   -5.0
i2    NaN
i3    8.0
i4    3.0
i5    0.0
i6   -8.0
i7    NaN
i8   -8.0
i9   -7.0
Name: c3, dtype: float64
i1    5.0
i2   -4.0
i3    NaN
i4   -5.0
i5    9.0
i6    8.0
i7    2.0
i8    NaN
i9    9.0
Name: c4, dtype: float64
i1    4.0
i2    2.0
i3   -8.0
i4    NaN
i5   -4.0
i6   -5.0
i7   -8.0
i8    1.0
i9    NaN
Name: c5, dtype: float64


c1    None
c2    None
c3    None
c4    None
c5    None
dtype: object
完整的 ipynb 文件和演示图请到 python草堂 群 457079928 下载。 如果有不同的意见也可以到那里讨论。
感谢 群友 @我是猫 在讨论过程的启发!


