python处理nc文件并输出_python中的.nc文件处理 | 05 NetCDF数据的进一步分析
NetCDF数据的进一步分析
比较不同数据集、不同季节的气候数据
import os
import numpy as np
import pandas as pd
import matplotlib.pyplot as plt
import cartopy.crs as ccrs
import cartopy.feature as cfeature
import seaborn as sns
import geopandas as gpd
import earthpy as et
import xarray as xr
import regionmask
# 绘制设置
sns.set(font_scale=1.3) # 字号
sns.set_style("white",{'font.family': 'Times New Roman'}) # 主题
读取数据集
2006-2099年月最高气温
data_path_monthly = 'http://thredds.northwestknowledge.net:8080/thredds/dodsC/agg_macav2metdata_tasmax_BNU-ESM_r1i1p1_rcp45_2006_2099_CONUS_monthly.nc'
with xr.open_dataset(data_path_monthly) as file_nc:
monthly_forecast_temp_xr=file_nc
monthly_forecast_temp_xr
## 读取矢量数据
states_path = "ne_50m_admin_1_states_provinces_lakes"
states_path = os.path.join(
states_path, "ne_50m_admin_1_states_provinces_lakes.shp")
states_gdf=gpd.read_file(states_path)
cali_aoi=states_gdf[states_gdf.name=="California"]
# 获取aoi的左下-右上经纬度坐标
def get_aoi(shp, world=True):
"""Takes a geopandas object and converts it to a lat/ lon
extent """
lon_lat = {}
# Get lat min, max
aoi_lat = [float(shp.total_bounds[1]), float(shp.total_bounds[3])]
aoi_lon = [float(shp.total_bounds[0]), float(shp.total_bounds[2])]
# Handle the 0-360 lon values
if world:
aoi_lon[0] = aoi_lon[0] + 360
aoi_lon[1] = aoi_lon[1] + 360
lon_lat["lon"] = aoi_lon
lon_lat["lat"] = aoi_lat
return lon_lat
cali_bounds=get_aoi(cali_aoi)
# 数据切片
start_date="2059-12-15"
end_date="2099-12-15"
cali_temp=monthly_forecast_temp_xr["air_temperature"].sel(
time=slice(start_date,end_date),
lon=slice(cali_bounds["lon"][0],cali_bounds["lon"][1]),
lat=slice(cali_bounds["lat"][0],cali_bounds["lat"][1]))
cali_temp
print("Time Period start: ", cali_temp.time.min().values)
print("Time Period end: ", cali_temp.time.max().values)
Time Period start: 2059-12-15 00:00:00
Time Period end: 2099-12-15 00:00:00
# 掩膜
cali_mask=regionmask.mask_3D_geopandas(cali_aoi,
monthly_forecast_temp_xr.lon,
monthly_forecast_temp_xr.lat)
cali_temp_masked=cali_temp.where(cali_mask)
cali_temp_masked.dims
('time', 'lat', 'lon', 'region')
cali_temp_masked.shape
(481, 227, 246, 1)
计算每个季节的平均最高温
# groupby()参数:time.season time.month time.year
cali_season_summary=cali_temp_masked.groupby(
"time.season").mean("time",skipna=True)
cali_season_summary.shape # 汇总成四个季节
(4, 227, 246, 1)
# (DJF=Dec-Feb, MAM=Mar-May,. JJA=Jun-Aug, SON=Sep-Nov)
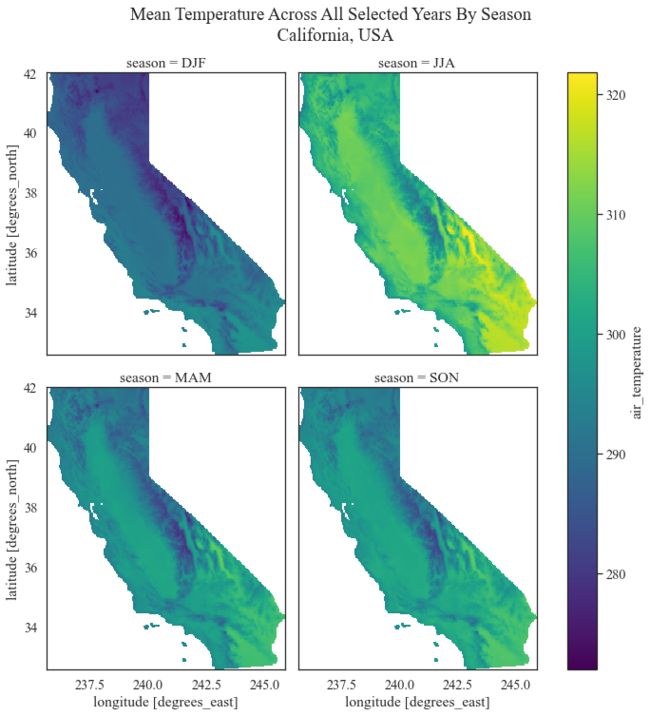
cali_season_summary.plot(col="season",col_wrap=2,figsize=(10,10))
plt.suptitle("Mean Temperature Across All Selected Years By Season n California, USA",
y=1.05)
plt.show()
计算每年的每个季节的均值变化
String in the ‘#offset’ to specify the step-size along the resampled dimension
‘AS’: year start
‘QS-DEC’: quarterly, starting on December 1
‘MS’: month start
‘D’: day
‘H’: hour
‘Min’: minute
# Resample the data by season across all years
cali_season_mean_all_years = cali_temp_masked.resample(
time='QS-DEC', keep_attrs=True).mean()
cali_season_mean_all_years.shape
(161, 227, 246, 1)
# Summarize each array into one single (mean) value
cali_seasonal_mean = cali_season_mean_all_years.groupby('time').mean([
"lat", "lon"])
cali_seasonal_mean.shape
(161, 1)
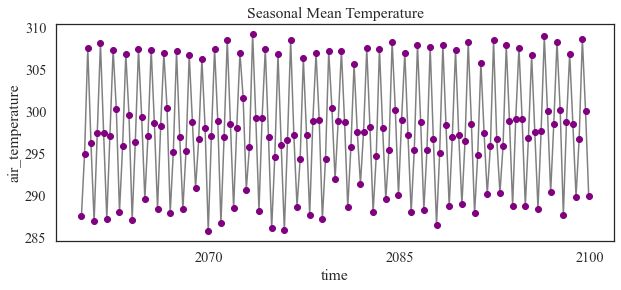
f, ax = plt.subplots(figsize=(10, 4))
cali_seasonal_mean.plot(marker="o",
color="grey",
markerfacecolor="purple",
markeredgecolor="purple")
ax.set(title="Seasonal Mean Temperature")
plt.show()
# 转换成pd格式
cali_seasonal_mean_df = cali_seasonal_mean.to_dataframe()
cali_seasonal_mean_df.head()
# 导出为csv
cali_seasonal_mean_df.to_csv("cali-seasonal-temp.csv")
分季节绘制均值变化
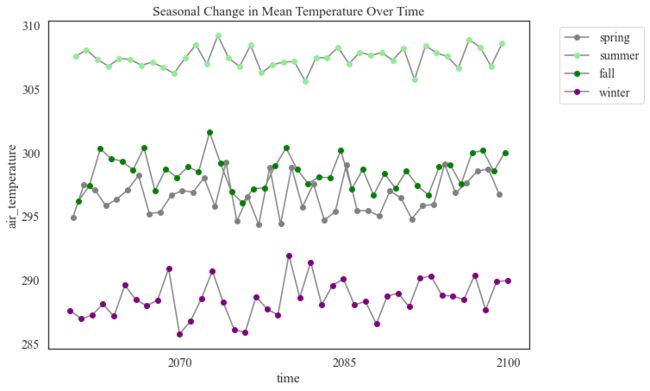
colors={3:"grey",6:"lightgreen",9:"green",12:"purple"}
seasons={3:"spring",6:"summer",9:"fall",12:"winter"}
f,ax=plt.subplots(figsize=(10,7))
for month,arr in cali_seasonal_mean.groupby("time.month"):
arr.plot(ax=ax,
color="grey",
marker="o",
markerfacecolor=colors[month],
markeredgecolor=colors[month],
label=seasons[month])
ax.legend(bbox_to_anchor=(1.05,1),loc="upper left")
ax.set(title="Seasonal Change in Mean Temperature Over Time")
plt.show()
参考链接:
{ {o.name}}
{ {m.name}}


