转载自:
https://github.com/crazyhottommy/getting-started-with-genomics-tools-and-resources
基因组学和数据科学用的Unix, R 和python工具和资源
大神杰作,保存备学。。。。。。
Table of content
- General
- Courses
- Some biology
- Some statistics
- linear algebra
- Bayesian Statistics
- Learning Latex
- Linux commands
- Do not give me excel files!
- How to name files
- parallelization
- Statistics
- Data transfer
- Website
- profile R code
- updating R
- Better R code
- Shiny App
- R tools for data wrangling, tidying and visualizing.
- Sankey graph
- Handling big data in R
- Write your own R package
- Documentation
- handling arguments at the command line
- visualization in general
- Javascript
- python tips and tools
- machine learning
- Amazon cloud computing
- Genomics-visualization-tools
- Databases
- Large data consortium data mining
- Integrative analysis
- Interactive visualization
- Tutorials
- MOOC(Massive Open Online Courses)
- git and version control
- blogs
- data management
- Automate your workflow, open science and reproducible research
- Survival curve
- Organize research for a group
- Clustering
- CRISPR related
- vector arts for life sciences
General
- So you want to be a computational biologist?
- Ten simple rules for biologists learning to program
- Scientific computing: Code alert Nature News.
- Some drawings about programming Very nice cartoon demonstrating useful concepts. https://wizardzines.com/
- Practical computing for biologist. One of my first books to get me started in coding.
- ModernDive An Introduction to Statistical and Data Sciences via R
- Introduction to Data Science by Rafael A. Irizarry.
- Learning Statistics with R
- Hands-on Machine Learning with R
- Reproducible Research Workflows with Snakemake and R
- The Biologist’s Guide to Computing A book written by @tjelvar_olsson
- A Primer for Computational Biology A nice book from Oregon State University. You can get a hard copy on Amazon https://www.amazon.com/Primer-Computational-Biology-Shawn-ONeil/dp/0870719262.
- Computational Genomics With R A nice book from Altuna Akalin.
- Modern Statistics for Modern Biology written by Prof. Susan Holmes from Stanford. I plan to read through it. a nice book using R for modern biology! looks awesome!
- An Introduction To Applied Bioinformatics Interactive lessons in bioinformatics
- Feature Engineering and Selection: A Practical Approach for Predictive Models by Kuhn and Johnson https://bookdown.org/max/FES
- Agile Data Science with R
- Offensieve programming book in R.
- The Biostar Handbook: A Beginner's Guide to Bioinformatics I am honored to be a co-author of this book. My ChIP-seq section was released by the mid of 2017.
- Beginner's Handbook to Next Generation Sequencing Everything you need to know about starting a sequencing project
- Another Book on Data Science:Learn R and Python in Parallel compares R and python side by side.
- A New Online Computational Biology Curriculum PLOS genetics paper.
- Bioinformatics core competencies for undergraduate life sciences education
- PH525x series - Biomedical Data Science The best course to get you started with genomics using R. I have taken 3 times for the same course to get a deep understanding of the concepts and R commands. Now everything can be found here from Rafael Irizarry lab: http://rafalab.github.io/pages/harvardx.html
- The Bioconductor 2018 Workshop Compilation very rich!
- Bioconductor for Genomics Data sciences Coursera course.
- bioc workflow genomic annotation
- Expanding the computational toolbox for mining cancer genomes Nature Review.
- some repos from command line to rstats and github
- 2016 review Coming of age: ten years of next-generation sequencing technologies
- Cancer genomics — from bench to bedside: review papers from Nature
- SequencEnG: an Interactive Knowledge Base of Sequencing Techniques
Courses
- The Missing Semester of Your CS Education These MIT Classes teach you all about advanced topics within CS, from operating systems to machine learning, but there’s one critical subject that’s rarely covered, and is instead left to students to figure out on their own: proficiency with their tools. We’ll teach you how to master the command-line, use a powerful text editor, use fancy features of version control systems, and much more!
- applied computational genomics by Aaron Quinlan, the creator of bedtools and many other cool tools.
- BMMB 852: Applied Bioinformatics (Fall, 2016) by Istvan Albert, the creator of biostars.
- JHU EN.600.649: Computational Genomics: Applied Comparative Genomics by Michael Schatz.
- Introduction to Computational Biology by Mike Love.
- Advanced Data Science by Jeff Leek.
- Data Science for Biological, Medical and Health Research: Notes for 431: R focused
- Various TeachingMaterial collected by Laurent Gatto.
- NGS sequence analysis
- bioinformatics-workbook
- Reproducible Quantitative Methods from Mozilla science lab.
- bio-info courses
- MIT Computational Biology: Genomes, Networks, Evolution, Health - Fall 2018 - 6.047/6.878/HST.507by Manolis Kellis
- MIT machine learning in Genomics by Manolis Kellis.
- MIT linear algebra course by Gilbert Strang
- Generalized Additive Models in R This short course will teach you how to use these flexible, powerful tools to model data and solve data science problems. GAMs offer offer a middle ground between simple linear models and complex machine-learning techniques, allowing you to model and understand complex systems.
Some biology
If you are from fields outside of biology, places to get you started:
- Tales from the Genome A course by Udacity and 23andMe.
- The Biology of Cancer A classic text book by Robert A. Weinberg. A must read for all cancer biologists.
- Molecular Biology of the Cell A text book
- Learn Genetics from University of Utah learning center.
- iBiology offers several different types of courses
- courses from khanacademy.org
Some statistics
- Elementary Statistical Modeling for Applied Biostatistics I plan to read this one!!
- seeing theory The goal of the project is to make statistics more accessible to a wider range of students through interactive visualizations.
- Points of Significance: Interpreting P values
- statistics for biologists
- Advanced Statistical Computing by Roger Peng.
- fiveMinuteStats
- Learning Statistics with R
- Statistical Modeling of High Dimensional Counts by Mike love on RNAseq counts modeling.
linear algebra
- Essence of linear algebra by threebrownoneblue
- 18.06 from Gilbert Strang
- Matrix Methods in Data Analysis, Signal Processing, and Machine Learning from Gilbert Strang
- Introduction to Applied Linear Algebra – Vectors, Matrices, and Least Squaresusing Julia language.
- Common statistical tests are linear models (or: how to teach stats)
- Course materials for applied regression STATS191 stanford
Bayesian Statistics
- Introduction to Bayesian Statistics STATS331 from Brendon Brewer.
- Introduction to Empirical Bayes by David Robinson using baseball examples.
- Statistical Rethinking github link https://github.com/rmcelreath/statrethinking_winter2019
- Bayesian Data Analysis demos for R
- Doing Bayesian Data Analysis in brms and the tidyverse a book.
Learning Latex
- draw your symbols
- The Best Way to Support LaTeX Math in Markdown with MathJax
- TinyTeX A lightweight, cross-platform, portable, and easy-to-maintain LaTeX distribution based on TeX Live
- Math expression http://www.math.mcgill.ca/yyang/regression/RMarkdown/example.html
- intro to Latex2 chapter 3
Linux commands
- Greg Wilson's youtube videos on unix shell
- A Bioinformatician's UNIX Toolbox from Heng Li
- Linux command line exercises for NGS data processing
- command line bootcamp teaches you unix command step by step
- Unix in your browser. Maybe useful for teaching bash?
- A Book for Anyone to Get Started with Unix
- bash one-liners for bioinformatics
- some of my bash one-liner collections
- Use the Unofficial Bash Strict Mode (Unless You Looove Debugging)
- Defensive BASH Programming very good read for bash programming.
- Better Bash Scripting in 15 Minutes
- bash pitfalls
- Advancing in the Bash Shell
- Bash tips
 image
image - Bash by example
- process substitution: Using Names Pipes and Process Substitution in Bioinformatics Handy Bash feature: Process Substitution
- NGS Advanced Beginner/Intermediate Shell
- Commonly used commands for PBS scheduler:Monitoring and Managing Your Job
- test your unix skills at cmd challenge
- people say awk is not part of bioinformats :) Still very useful parsing plain text files. Steve's Awk Academy
- intro-bioinformatics: Website and slides for intro to bioinformatics class at Fred Hutch
 image
image - tmate:Instant terminal sharing
- tmux is a terminal multiplexer similar to
screenbut have more features.
tmux cheatsheet
tmux config
tmux install without root
- All about redirection
Theory and quick reference
There are 3 file descriptors, stdin, stdout and stderr (std=standard).
Basically you can:
redirect stdout to a file
redirect stderr to a file
redirect stdout to a stderr
redirect stderr to a stdout
redirect stderr and stdout to a file
redirect stderr and stdout to stdout
redirect stderr and stdout to stderr
1 'represents' stdout and 2 stderr.
A little note for seeing this things: with the less command you can view both stdout (which will remain on the buffer) and the stderr that will be printed on the screen, but erased as you try to 'browse' the buffer.
- stdout 2 file
This will cause the ouput of a program to be written to a file.
ls -l > ls-l.txt
Here, a file called 'ls-l.txt' will be created and it will contain what you would see on the screen if you type the command 'ls -l' and execute it.
- stderr 2 file
This will cause the stderr ouput of a program to be written to a file.
grep da * 2> grep-errors.txt
Here, a file called 'grep-errors.txt' will be created and it will contain what you would see the stderr portion of the output of the 'grep da *' command.
- stdout 2 stderr
This will cause the stderr ouput of a program to be written to the same filedescriptor than stdout.
grep da * 1>&2
Here, the stdout portion of the command is sent to stderr, you may notice that in differen ways.
- stderr 2 stdout
This will cause the stderr ouput of a program to be written to the same filedescriptor than stdout.
grep * 2>&1
Here, the stderr portion of the command is sent to stdout, if you pipe to less, you'll see that lines that normally 'dissapear' (as they are written to stderr) are being kept now (because they're on stdout).
- stderr and stdout 2 file
This will place every output of a program to a file. This is suitable sometimes for cron entries, if you want a command to pass in absolute silence.
rm -f $(find / -name core) &> /dev/null
This (thinking on the cron entry) will delete every file called 'core' in any directory. Notice that you should be pretty sure of what a command is doing if you are going to wipe it's output.
- change permissions of files
each digit is for: user, group and other.
chmod 754 myfile: this means the user has read, write and execute permssion; member in the same group has read and execute permission but no write permission; other people in the world only has read permission.
4 stands for "read",
2 stands for "write",
1 stands for "execute", and
0 stands for "no permission."
So 7 is the combination of permissions 4+2+1 (read, write, and execute), 5 is 4+0+1 (read, no write, and execute), and 4 is 4+0+0 (read, no write, and no execute).
It is sometimes hard to remember. one can use the letter:The letters u, g, and o stand for "user", "group", and "other"; "r", "w", and "x" stand for "read", "write", and "execute", respectively.
chmod u+x myfile
chmod g+r myfile
Do not give me excel files!
- scary-excel-stories
- convert xlsx to csv: xlsx2csv
- csvkit
- csvtk A complete .csv/.tsv toolkit including join command.
- GNU datamash
- tabtk Toolkit for processing TAB-delimited format from Heng Li, the author of
Samtools,BWAand many others. - Another cross-platform, efficient, practical and pretty CSV/TSV toolkit in Golang
- visidata A console spreadsheet tool for discovering and arranging data
- xsv A fast CSV toolkit written in Rust.
- Going from a human readable Excel file to a machine-readable csv with {tidyxl}
- eBay's TSV Utilities: Command line tools for large, tabular data files. Filtering, statistics, sampling, joins and more. https://ebay.github.io/tsv-utils/
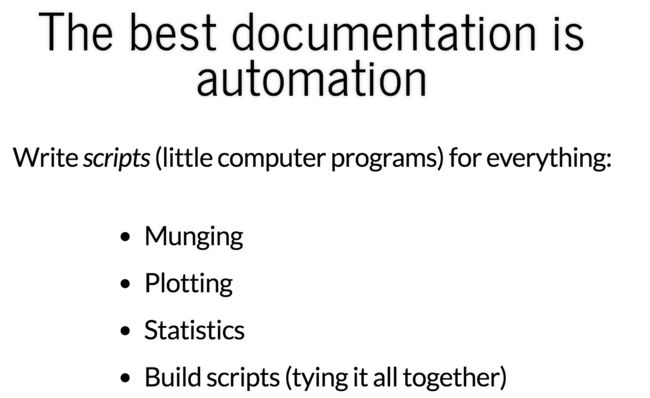
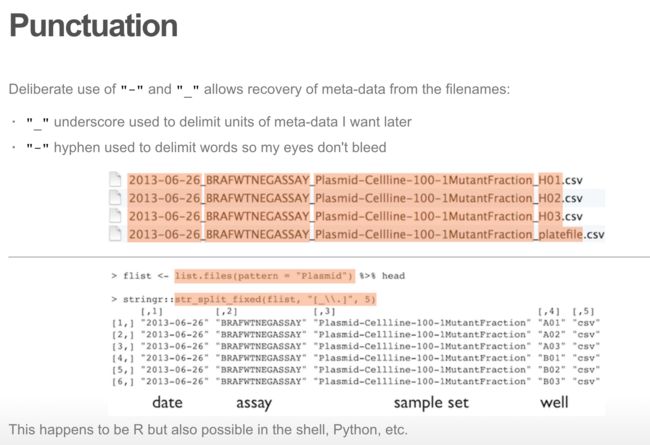
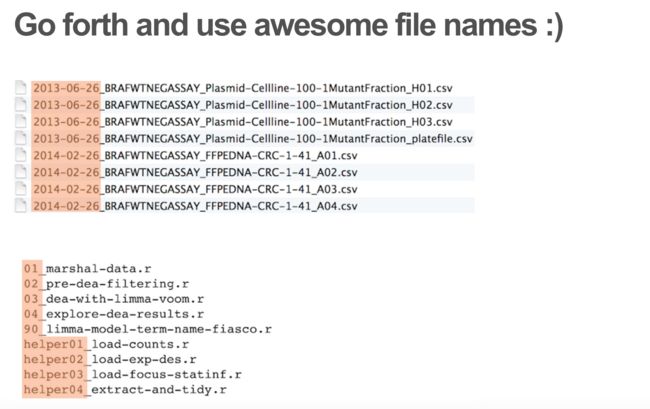
How to name files
It is really important to name your files correctly! see a ppt by Jenny Bryan.
Three principles for (file) names:
- Machine readable (do not put special characters and space in the name)
- Human readable (Easy to figure out what the heck something is, based on its name, add slug)
- Plays well with default ordering:
Put something numeric first
Use the ISO 8601 standard for dates (YYYY-MM-DD)
Left pad other numbers with zeros
If you have to rename the files...
- brename A cross-platform command-line tool for safely batch renaming files/directories via regular expression (supporting Windows, Linux and OS X) from ShenWei is very useful!
Good naming of your files can help you to extract meta data from the file name
- dirdf Create tidy data frames of file metadata from directory and file names.
> dir("examples/dataset_1/")
[1] "2013-06-26_BRAFWTNEG_Plasmid-Cellline-100_A01.csv"
[2] "2013-06-26_BRAFWTNEG_Plasmid-Cellline-100_A02.csv"
[3] "2014-02-26_BRAFWTNEG_FFPEDNA-CRC-1-41_D08.csv"
[4] "2014-03-05_BRAFWTNEG_FFPEDNA-CRC-REPEAT_H03.csv"
[5] "2016-04-01_BRAFWTNEG_FFPEDNA-CRC-1-41_E12.csv"

> library("dirdf")
> dirdf("examples/dataset_1/", template="date_assay_experiment_well.ext")
        date     assay           experiment well ext                                          pathname
1 2013-06-26 BRAFWTNEG Plasmid-Cellline-100  A01 csv 2013-06-26_BRAFWTNEG_Plasmid-Cellline-100_A01.csv
2 2013-06-26 BRAFWTNEG Plasmid-Cellline-100  A02 csv 2013-06-26_BRAFWTNEG_Plasmid-Cellline-100_A02.csv
3 2014-02-26 BRAFWTNEG     FFPEDNA-CRC-1-41  D08 csv     2014-02-26_BRAFWTNEG_FFPEDNA-CRC-1-41_D08.csv
4 2014-03-05 BRAFWTNEG   FFPEDNA-CRC-REPEAT  H03 csv   2014-03-05_BRAFWTNEG_FFPEDNA-CRC-REPEAT_H03.csv
parallelization
Using these tool will greatly improve your working efficiency and get rid of most of your for loops.
- xargs
- GNU parallel. one of my post here
- gxargs by Brent Pedersen. Written in GO.
- rush A cross-platform command-line tool for executing jobs in parallel by Shen Wei. I use his other tools such as
brenameandcsvtk. - future: Unified Parallel and Distributed Processing in R for Everyone
- furrr Apply Mapping Functions in Parallel using Futures
Statistics
- Essence of linear algebra
- statistics for biologists A collection of Nature articles on statistics in biology.
Data transfer
- keep an eye on the dat project! https://blog.datproject.org/2018/04/24/data-sharing-at-institutions-and-beyond-with-dat/
a blog post by Mark Ziemann http://genomespot.blogspot.com/2018/03/share-and-backup-data-sets-with-dat.html
Website
- rmarkdown website
- A step by step tutorial
- Up and running with blogdown
- summer of blogdown
- bookdown advanced slide
- make a hugo blog from scratch to understand Hugo if you use blogdown.
- Tips for using the Hugo academic theme
- Custom domain hosting with Github and Namecheap
- MkDocs is a fast, simple and downright gorgeous static site generator that's geared towards building project documentation. Documentation source files are written in Markdown, and configured with a single YAML configuration file.
updating R
- R upgrading can be a smooth process
- updating R a blog post by L. Collado-Torres.
- update your R version in a breeze ( on OSX)
- updating R
# Install new version of R (lets say 3.5.0 in this example)

# Create a new directory for the version of R
fs::dir_create("~/Library/R/3.5/library")

# Re-start R so the .libPaths are updated

# Lookup what packages were in your old package library
pkgs <- fs::dirname(fs::dir_ls("~/Library/R/3.4/library"))

# Filter these packages as needed

# Install the packages in the new version
install.packages(pkgs)
Better R code
- assertr
- Tools for Working with ...
- here
- Inline testthat tests with roxygen2:roxytest
- Non-invasive pretty printing of R code: styler
- Static Code Analysis for R: lintr It checks adherence to a given style, syntax errors and possible semantic issues
- Make R a little bit stricter: strict
also readoffensive programming Book
Shiny App
- [Omicsplayground)[https://github.com/bigomics/omicsplayground]
- A Framework for Building Robust Shiny Apps golem
- [bootstrapllib}(https://rstudio.github.io/bootstraplib/) Tools for styling shiny and rmarkdown from R via Bootstrap (3 or 4) Sass
profile R code
- profvis Interactive Visualizations for Profiling R Code.
- proffer The proffer package profiles R code to find bottlenecks.
- rco - The R Code Optimizer Make your R code run faster! rco analyzes your code and applies different optimization strategies that return an R code that runs faster.
R tools for data wrangling, tidying and visualizing.
Common statistical tests are linear models (or: how to teach stats)
What They Forgot to Teach You About R by Jennifer Bryan, Jim Hester. you know it is good.
Rstudio2020 https://rstudio-conf-2020.github.io/what-they-forgot/Fundamentals of Data Visualization by Claus O. Wilke.
from data to vis From Data to Viz leads you to the most appropriate graph for your data. It links to the code to build it and lists common caveats you should avoid.
Data Visualization: A practical introduction A book by Kieran Healy from Duke University. Nice one to have!
Functional programming and unit testing for data munging with R
R workshops some resources for R related materials.
RStartHere A guide to some of the most useful R Packages that we know about, organized by their role in data science.
biobroom:Turn Bioconductor objects into tidy data frames
readr
visdat visualizing your missing data and more.
tidyr
stringr
glue Glue strings to data in R. Small, fast, dependency free interpreted string literals
purrr tutorial by jenny bryan. functional programming in R.
Row-oriented workflows in R with the tidyverse
pmapis your friend :)janitor simple tools for data cleaning in R.
tidyeval resources
Rstudio tidyeval video
Tidy evaluation, most common actions
Tidy Eval Meets ggplot2 a blog post.
Tidy evaluation in ggplot2 from tidyverse.
tidyeval patterns
Tidy eval now supports glue strings
Non-standard evaluation, how tidy eval builds on base R
My First Steps into The World of Tidy Eval
tidyeval shiny app
tidyeval bookdown
reusing tidyverse code
dplry
set_na_where(): a nonstandard evaluation use case
programming with dplyr A great read on non-standard evaluation, quoating and qusiquotation. then the following two packages help you to deal with that.
replyr An R package for fluid use of dplyr.
Introduction of Parameterized dplyr expression using replyr
wrapr wraps R functions debugging and better standard evaluation.
Letfunction. blog post wrapr: for sweet R codeEasy machine learning pipelines with pipelearner: intro and call for contributors github page
plot ROC with tidyverse
csv fingerprint
ggplot2
ggplot2 tips
Demystifying ggplot2 Learn how to write ggplot2 extensions.
A List of ggplot2 extensions
using ggplot2 in packages
If you already know the mapping in advance (like the above example) you should use the .data pronoun from rlang to make it explicit that you are referring to the drv in the layer data and not some other variable named drv (which may or may not exist elsewhere). To avoid a similar note from the CMD check about .data, use #' @importFrom rlang .data in any roxygen code block (typically this should be in the package documentation as generated by usethis::use_package_doc()).
- If you know the mapping or facet specification is col in advance, use aes(.datacol).
- If col is a variable that contains the column name as a character vector, use aes(.data[[col]] or vars(.data[[col]]).
- If you would like the behaviour of col to look and feel like it would within aes() and vars(), use aes({{ col }}) or vars({{ col }}).
- gghighlight: Highlight ggplot's Lines and Points with Predicates
- Anatomy of gghighlight
- nice ggplot themes
- ggsci offers a collection of ggplot2 color palettes inspired by scientific journals, data visualization libraries, science fiction movies, and TV shows.
- The goal of paletteer is to be a comprehensize collection (666!)of color palettes in R using a common interface
- randomcolR An R package for generating attractive and distinctive colors.
- colourpicker A colour picker tool for Shiny and for selecting colours in plots (in R). R blogger post
- ggforce: facet_zoom() to zoom in part of the figure! and many more.
- ggpubr: ‘ggplot2’ Based Publication Ready Plots. add pvalues. this saves me from customerizing my ggplot2 figures.
- op 50 ggplot2 Visualizations - The Master List (With Full R Code)
- kableExtra Construct Complex Table with knitr::kable() + pipe.
- ggedit – interactive ggplot aesthetic and theme editor.
- trelliscopejs is an R package that brings faceted visualizations to life while plugging in to common analytical workflows like ggplot2 or the “tidyverse”.
- Plotting background data for groups with ggplot2
- Ordering categories within ggplot2 facets
- plotly for R
- rematch2Tidy output from regular expression matches
- Make waffle (square pie) charts in R
- Bring the power of R to the command line: littler Rio A wrapper by Jeroen Janssens, the author of data science at the command line
- htmlwidgets for R including
d3heatmapfor interactive heatmaps. - focus() on correlations of some variables with many others
- Explore correlations in R with corrr
- Unit test in R
- sinaplot: an enhanced chart for simple and truthful representation of single observations over multiple classes.
ggforcehasgeom_sinafor the same purpose. - complexHeatmaps
- superheat Another heatmap package worth learning besides
ComplexHeatmap. Not as flexiable as ComplexHeatmap, but can be handy when the function you want has been implemented. - iheatmapr is an R package for building complex, interactive heatmaps using modular building blocks.
- heatmap:gapmap
- dendsort:Modular Leaf Ordering Methods for Dendrogram Nodes
- dendextend
- Interactive Heat Maps for R Using plotly
- Multiple plots on a page
- ggExtra
- cowplot -- An add-on to the ggplot2 plotting package
- ggplot2 - Easy way to mix multiple graphs on the same page - R software and data visualization
- Extract Tables from PDFs
- Alternative to venndiagram! upSetR
- hierarchicalSets
- Intervene is a tool for intersection and visualization of multiple gene or genomic region sets.
- In-depth introduction to machine learning in 15 hours of expert videos
- Data Analysis and Visualization Using RThis is a course that combines video, HTML and interactive elements to teach the statistical programming language R.
- These are the course notes for the Monash Bioinformatics Platform’s “R More” course
- gitbook: Getting used to R, RStudio, and R Markdown
- Technical Foundations of Informatics a free book to teach you R and many others.
- Efficient R programming
- R for Data Science by Garrett Grolemund and Hadley Wickham
Sankey graph
- ggalluvial
- ggforce
geom_parallel_sets() - [Alluvial Diagrams with ggforce]
Handling big data in R
- A data.table and dplyr tour A blog post compare dplyr and data.table side by side.
- Lightning Fast Serialization of Data Frames for R faster than
data.table,feather. - Rpub post: Handling large data sets in R
- The disk.frame package aims to be the answer to the question: how do I manipulate structured tabular data that doesn’t fit into Random Access Memory (RAM)
dtplyrandtidyfastare teaming up (well, at least in this blog post)- Fast reading of delimited files with vroom The fastest delimited reader for R, 1.40 GB/sec/sec.
- stash: Naive on-disk caching in R
- qs: Quick serialization of R objects
- The fst package for R provides a fast, easy and flexible way to serialize data frames. With access speeds of multiple GB/s, fst is specifically designed to unlock the potential of high speed solid state disks that can be found in most modern computers. Data frames stored in the fst format have full random access, both in column and rows.
- The arrow package exposes an interface to the Arrow C++ library to access many of its features in R. This includes support for analyzing large, multi-file datasets (open_dataset()), working with individual Parquet (read_parquet(), write_parquet()) and Feather (read_feather(), write_feather()) files, as well as lower-level access to Arrow memory and messages.
Write your own R package
- usethis workflow for package development
- Developing R Packages with usethis and GitLab CI: Part I
- Writing an R package from scratch a blog post.
- available helps you name your R package
- goodpractice An R package on Advice on R packages.
- R package primer: a minimal tutorial
- Write your own R package
- R packages a book by Hadley Wickham.
- Developing R packages from Jeff leek.
- Sinew is a R package that generates a roxygen2 skeleton populated with information scraped from the function script.
- Automatic tools for improving R packages
devtools:spell_check()goodpractice:gp()andpkgdown:build_site(). - blog post How to develop good R packages (for open science)
- Easy and efficient debugging for R packages: debugme
- Non-invasive pretty printing of R code
- usethis The goal of usethis is to automate many common package and analysis setup tasks.
- Mastering Software Development in R by Roger Peng et.al.
- The tidyverse style guide by Hadley Wickham.
- submitting your package to bioconductor
Documentation
- This is a must read for writing good documentations: A blog post. I saved it to a pdf and uploaded to this repo.
handling arguments at the command line
- docopt.R tutorial
- python version
- Generate a CLI tool from a Python module/function
- Introducing Python Fire, a library for automatically generating command line interfaces
- Patterns and anti-patterns for writing command-line bioinformatics software by Titus.
visualization in general
- Nature Methods point of view data visulization
- A tutorial for the free Inkscape cross-platform vector graphics editor
- gimp for bit-map based figures.
- data vis resource from Sabah
Javascript
- JavaScript versus Research Computing from Greg Wilson, the founder of software carpentry.
python tips and tools
- some nice free python books: Think python etc
- Interactive python nice interactive books help you learn python.
- 30 Python Language Features and Tricks You May Not Know About
- intermediatePython
- The Hitchhiker’s Guide to Python!
- Python 3 for Scientists
- Python FAQ: Why should I use Python 3?
- gitbook: Computational and Inferential Thinking; The Foundations of Data Science
- A collection of python courses online
- tpot:A Python tool that automatically creates and optimizes machine learning pipelines using genetic programming.
- Easy to use Python API wrapper to plot charts with matplotlib, plotly, bokeh and more:chartpy creates a simple easy to use API to plot in a number of great Python chart libraries like plotly (via cufflinks), bokeh and matplotlib, with a unified interface. You simply need to change a single keyword to change which chart engine to use (see below), rather than having to learn the low level details of each library.
- Top 8 resources for learning data analysis with pandas
- Jupyter Notebooks for the Python Data Science Handbook
- kiteThe smart copilot for programmers. works with atom, sublime, vim and emacs!
machine learning
- Practical Machine Learning with Python: standford crowd course
Amazon cloud computing
Intro to AWS Cloud Computing
Genomics-visualization-tools
There are many online web based tools for visualization of (cancer) genomic data. I put my collections here. I use R for visulization.
see a nice post by using python by Radhouane Aniba:Genomic Data Visualization in Python
- UCSC cancer genome browser It has many data including TCGA data buit in, and can be very handy for both bench scientist and bioinformaticians.
- UCSC Xena. A new tool developed by UCSC team as well. Poteintially very useful, but need more tutorials to follow.
- UCSC genome browser. One of the most famous genome browser and my favoriate. Every person studying genetics, genomics and molecular biology needs to know how to use it. Tutorials from OpenHelix.
- Epiviz 3 is an interactive visualization tool for functional genomics data. It supports genome navigation like other genome browsers, but allows multiple visualizations of data within genomic regions using scatterplots, heatmaps and other user-supplied visualizations.
- Mutation Annotation & Genome Interpretation TCGA: MAGA
- GeneProteinViz (GPViz) is a versatile Java-based software for dynamic gene-centered visualization of genomic regions and/or variants.
- ProteinPaint: Web Application for Visualizing Genomic Data The software developed for this project highlights critical attributes about the mutations, including the form of protein variant (e.g. the new amino acid as a result of missense mutation), the name of sample from which the mutation was identified, whether the mutation is somatic or germline,
Databases
- protein-protein interaction databases
- A compilation of protein-protein interaction resources Akhilesh Bajpai and Sravanthi Davuluri (Correspondence: Acharya KK, [email protected])
- DisGeNET is a discovery platform integrating information on gene-disease associations (GDAs) from several public data sources and the literature
- Cancer3D is a database that unites information on somatic missense mutations from TCGA and CCLE, allowing users to explore two different cancer-related problems at the same time: drug sensitivity/biomarker identification and prediction of cancer drivers
- UCSCXenaTools An R package for accessing genomics data from UCSC Xena platform, from cancer multi-omics to single-cell RNA-seq
- PharmacoGx Contains a set of functions to perform large-scale analysis of pharmacogenomic data. public data sets such as CCLE can be easily downloaded!
- clinical intepretations of variants in cancer
- R Wrapper for DGIdb Drug-gene interaction database.
- BioGrid Welcome to the Biological General Repository for Interaction Datasets
- The IUPHAR/BPS Guide to PHARMACOLOGY in 2016: towards curated quantitative interactions between 1300 protein targets and 6000 ligands
- Public data and open source tools for multi-assay genomic investigation of disease
- cancer cell metabolism genes
- oncogenes and tumor suppressors biostar post and TSgene
- DriverDB: A database for cancer driver gene/mutation
- Interaction of genes: GENEMANIA
- DATA DISCOVERY PLATFORM:Designed for researchers who use, share and collaborate on human genomic data
- zenodo: research shared
- dataMed biomedical and healthCAre Data Discovery Index Ecosystem.
- repostive Discover a better way of searching for genomic data.
- The NCI's Genomic Data Commons (GDC) provides the cancer research community with a unified data repository that enables data sharing across cancer genomic studies in support of precision medicine. A copy of TCGA and TARGET data? Data Release Notes
- OASIS genomics from Pfizer. processed data from TCGA, CCLE, GTEx.
- TCGA alternative splicing
- ISOexpresso: a web-based platform for isoform-level expression analysis in human cancer
- omics databse The Omics Discovery Index (OmicsDI) provides dataset discovery across a heterogeneous, distributed group of Transcriptomics, Genomics, Proteomics and Metabolomics data resources spanning eight repositories in three continents and six organisations, including both open and controlled access data resources. The resource provides a short description of every dataset: accession, description, sample/data protocols biological evidences, publication, etc. Based on these metadata, OmicsDI provides extensive search capabilities, as well as identification of related datasets by metadata and data content where possible. In particular, OmicsDI identifies groups of related, multi-omics datasets across repositories by shared identifiers.
- MAGI Mutation Annotation &Genome Interpretation for TCGA data.
- How to successfully apply for access to dbGaP
- Human cell Atlas some preview data sets https://preview.data.humancellatlas.org/
- DepMap A Cancer Dependency Map to systematically identify genetic and pharmacologic dependencies and the biomarkers that predict them.
Large data consortium data mining
- AnnotationHub bioconductor package for TCGA and epigenome roadmap, ENCODE project.
- TCGAbiolinks bioconductor package.
- GenomicDataCommons bioc package to acess GDC.
- RTCGA bioconductor
- f1000 workflow paper TCGA Workflow: Analyze cancer genomics and epigenomics data using Bioconductor packages
- paper Data mining The Cancer Genome Atlas in the era of precision cancer medicine
- CrossHub: a tool for multi-way analysis of The Cancer Genome Atlas (TCGA) in the context of gene expression regulation mechanisms.
- Ferret, a User-Friendly Java Tool to Extract Data from the 1000 Genomes Project
- EGA:European Genome-phenome Archive
- survival curves for TCGA data: a simple web tool
- Genetic determinants of cancer patient survival http://survival.cshl.edu/. https://twitter.com/jsheltzer/status/1150828456340574209?s=12
"..in some papers and presentations, biologists will use TCGA survival curves showing that their favorite gene is associated with poor prognosis to argue that their gene is super-important. This is weak evidence. Prognostic biomarkers are not necessarily strong cancer drivers" - AACR Project GENIE data guide
Integrative analysis
- High-dimensional genomic data bias correction and data integration using MANCIE correct batch effects for data from different sequencing methods. (RNAseq vs ChIPseq)
Interactive visualization
- Vega-lite A high-level grammar for visual analysis, built on top of Vega. Looks awesome!
- Introducing altair, an R interface to the Altair Python Package which you can use to build and render Vega-Lite chart-specifications.
Tutorials
- Ten quick tips for effective dimensionality reduction by Susan Holmes.
- PH525x series - Biomedical Data Science. Learn R and bioconductor.
- Principal Component Analysis Explained Visually
- PCA, MDS, k-means, Hierarchical clustering and heatmap. I wrote it.
- A tale of two heatmaps. I wrote it.
- Heatmap demystified. I wrote it.
- Cluster Analysis in R - Unsupervised machine learning very practical intro on STHDA website.
- I wrote on PCA, and heatmaps on Rpub
- A most read for clustering analysis for high-dimentional biological data:Avoiding common pitfalls when clustering
biological data - How does gene expression clustering work? A must read for
clustering. - How to read PCA plots for scRNAseq by VALENTINE SVENSSON.
- paper: Outlier Preservation by Dimensionality Reduction Techniques
"MDS best choice for preserving outliers, PCA for variance, & T-SNE for clusters"
How to Use t-SNE Effectively
Rtsne R package for T-SNE
rtsne An R package for t-SNE (t-Distributed Stochastic Neighbor Embedding)
a bug was inrtsne: https://gist.github.com/mikelove/74bbf5c41010ae1dc94281cface90d32t-SNE-Heatmaps Beta version of 1D t-SNE heatmaps to visualize expression patterns of hundreds of genes simultaneously in scRNA-seq.
PHATE dimensionality reduction method paper: http://biorxiv.org/content/early/2017/03/24/120378
Uniform Manifold Approximation and Projection (UMAP) is a dimension reduction technique that can be used for visualisation similarly to t-SNE, but also for general non-linear dimension reduction. The algorithm is founded on three assumptions about the data. Run from R: https://gist.github.com/crazyhottommy/caa5a4a4b07ee7f08f7d0649780832ef
umapr UMAP dimensionality reduction in R
Understanding UMAP very nice one to read!
Survival analysis of TCGA patients integrating gene expression (RNASeq) data
Tutorial: Machine Learning For Cancer Classification. It has four parts.
Learning bash scripting for beginners
Bedtools tutorial
Gemini explores your vcf, and slides.
GNU parallel
A Tutorial on Principal Component Analysis
StatQuest: PCA clearly explained
Computing Workflows for Biologists: A Roadmap
Best Practices for Scientific Computing
Google's R Style Guide
MOOC(Massive Open Online Courses)
- The Open Source Data Science Masters
- Path to a free self-taught education in Data Science!
- Path to a free self-taught education in Bioinformatics!
- CODING CLUB TUTORIALS
- Udacity
- Coursera
- edx
git and version control
- git intro by github
- How to Write a Git Commit Message
- Happy Git and GitHub for the useR A book by Jenny Bryan.
- learn git branching
- A Git Workflow Walkthrough Series
- paper:A Quick Introduction to Version Control with Git and GitHub
- paper:Ten Simple Rules for Taking Advantage of Git and GitHub
- software carpentry git novice lesson
- git best practise
- git-hub cheatsheet
- oh shit git! Git is hard: screwing up is easy, and figuring out how to fix your mistakes is fucking impossible. Git documentation has this chicken and egg problem where you can't search for how to get yourself out of a mess, unless you already know the name of the thing you need to know about in order to fix your problem.
- How to undo (almost) anything with Git
- A guide for astronauts (now, programmers using Git) about what to do when things go wrong: git flight rules
- An opinionated intermediate/advanced Git book: git in practise
blogs
- blogdown from yihui xie.
- Jekyll Jupyter Notebook plugin
- How to Use Plotly with Jekyll and Github Pages
- render Rmd pages into blog posts using updated rmarkdown::render function
data management
- youtube video from softwarecarpentry
- The FAIR Guiding Principles for scientific data management and stewardship
- Developing a modern data workflow for living data
- online course CN-2559-BEST-PRACTICES-BIOMEDICAL-RESEARCH-DATA-MANAGEMENT
- Ten Simple Rules for Creating a Good Data Management Plan
- Nine simple ways to make it easier to (re)use your data
- Dataone best practise Practices
- Research Data Management: A Primer Publication of the National Information Standards Organization
- Data management for biologists A blog post by Tjelvar Olsson. Also check his dtool
Automate your workflow, open science and reproducible research
Automation wins in the long run.

STEP 6 is usually missing!

The pic was downloaded from http://biobungalow.weebly.com/bio-bungalow-blog/everybody-knows-the-scientific-method
Workflow languages
Reviews
- A blog post comparing bash script, make, snakemake and nextflow.
- paper:A review of bioinformatic pipeline frameworks
- Existing Workflow systems
- Workflow management software for pipeline development in NGS
- Awesome pipeline toolkit list
Snakemake
- Snakemake [Docs] [Publication]
- Snakemake tutorial from Titus Brown 2019
- Snakemake tutorial from Titus Brown 2020
- snakePipes: facilitating flexible, scalable and integrative epigenomic analysis [Publication]
I am using snakemake and so far is very happy about it!
Nextflow
- Nextflow [Docs] [Publication]
- Nextflow DSL 2 modular syntax [Original GitHub issue]
- Nextflow Camp DSL 2 tutorial 2019
- CZ Biohub Nextflow tutorial 2019
- Nextflow workshop tutorial 2018
- Nextflow pipeline examples
- The nf-core framework for community-curated bioinformatics pipelines [Existing Workflows] [Publication]
- Curated list of Nextflow pipelines
- A Nextflow pipeline assembler for genomics and flowcraft Now you can track both the execution of a nextflowio pipeline AND the reports that it generates in real-time! You can even follow the reports (https://tinyurl.com/y854vftf ) and the pipeline execution.
Reproducible research
Awesome youtube video for reproducible workflow
A Realistic Guide to Making Data Available Alongside Code to Improve Reproducibility
A must read: Managing the analysis of high-throughput sequencing data
Reproducibility starts at home A series of blog posts by Jon Zelner.
docker intro
cyverse Reproducibility Tour
Conda hacks for data science efficiency
Practical Computational Reproducibility in the Life Sciences from Cell Systems.
Analysis validation has been neglected in the Age of Reproducibility
The Life & Times of a Reproducible Clinical Project https://jenthompson.me/slides/rmedicine2018/rmedicine2018#1
github Actions for R
Automate testing of your R package using Travis CI, Codecov, and testthat by Jean Fan.
Reproducible computational environments using containers
docker intro by Cyverse and singularity by upendra devisetty. I met him in UC Davis during 2018 ANGUS :)
rocker/binder Adds binder abilities on top of the rocker/tidyverse images.
Embedding containerized workflows inside data science notebooks enhances reproducibility
workflowr: organized + reproducible + shareable data science in R
Singularity Singularity enables users to have full control of their environment. Singularity containers can be used to package entire scientific workflows, software and libraries, and even data. This means that you don’t have to ask your cluster admin to install anything for you - you can put it in a Singularity container and run.
EMBL-bioIT singularity workshop
countinous analysis Reproducibility of computational workflows is automated using continuous analysis
The hard road to reproducibility commentary on Science Magzine.
Five selfish reasons to work reproducibly Genome Biology paper.
Make lessons from software carpentry
biomake GNU-Make-like utility for managing builds and complex workflows.
drake An R-focused pipeline toolkit for reproducibility and high-performance computing. Snakemake in R.
STAT545 Automating data analysis pipelines
biostar post:Job Manager to parallelize otherwise consecutive bash scripts
initial steps toward reproducible research
JupyterLab: the next generation of the Jupyter Notebook
Deepnote - Better UI for Jupyter and enables collaboration & working online without installing anything.
R notebook
CoCAL Collaborative Calculation in the Cloud
BEAKER THE DATA SCIENTIST'S LABORATORY
[nteract] notebook (https://nteract.io/)
A video by Dr.Keith A. Baggerly from MD Anderson The Importance of Reproducible Research in High-Throughput Biology very interesting, and Keith is really a fun guy!
paper: Ten Simple Rules for Reproducible Computational Research
open-research
Best Practice Data Life Cycle Approaches for the Life Sciences
Good Enough Practices in Scientific Computing We present a set of computing tools and techniques that every researcher can and should adopt. These recommendations synthesize inspiration from our own work, from the experiences of the thousands of people who have taken part in Software Carpentry and Data Carpentry workshops over the past six years, and from a variety of other guides. Unlike some other guides, our recommendations are aimed specifically at people who are new to research computing. Well worth reading!
A Quick Guide to Organizing Computational Biology Projects A must read for computational biologists!
Ten Simple Rules for Digital Data Storage
avoid
setwd()in your R script.here_here()comes to rescue.Have you ever had problem to reuse one of your own published figures due to copyright of the journal?
Here is the solution! from @LorenaABarba
As an early adopter of the Figshare repository, I came up with a strategy that serves both our open-science and our reproducibility goals, and also helps with this problem: for the main results in any new paper, we would share the data, plotting script and figure under a CC-BY license, by first uploading them to Figshare.
Survival curve
- Survival Analysis in R This tutorial was originally presented at the Memorial Sloan Kettering Cancer Center R-Presenters series on August 30, 2018 by Emily
- Survival plots have never been so informative: survminer package
- posts for survival analysis:
** Survival Analysis - 1 KM estimator
** Survival Analysis - 2 Cox's proportional hazards model
** Overall Survival Curves for TCGA and Tothill by RD Status
** Survival analysis of TCGA patients integrating gene expression (RNASeq) data - survminer
- survival analysis with TCGA
Organize research for a group
- slack:A messaging app for teams.
- Ryver.
- Trello lets you work more collaboratively and get more done.
Clustering
- densityCut: an efficient and versatile topological approach for automatic clustering of biological data
- Interactive visualisation and fast computation of the solution path: convex bi-clustering by Genevera Allen
cvxbiclustr and the clustRviz package coming. - optCluster: An R Package for Determining the Optimal Clustering Algorithm.
- iClusterPlus Integrative clustering of multiple genomic data using a joint latent variable model.
- ConsensusClusterPlus algorithm for determining cluster count and membership by stability evidence in unsupervised analysis.
CRISPR related
- CRISPR GENOME EDITING MADE EASY
- CRISPR design from Japan
- CRISPResso:Analysis of CRISPR-Cas9 genome editing outcomes from deep sequencing data
- CRISPR-DO: A whole genome CRISPR designer and optimizer in human and mouse
- CCTop - CRISPR/Cas9 target online predictor
- DESKGEN
- Genome-wide Unbiased Identifications of DSBs Evaluated by Sequencing (GUIDE-seq) is a novel method the Joung lab has developed to identify the off-target sites of CRISPR-Cas RNA-guided Nucleases
- WTSI Genome Editing (WGE) is a website that provides tools to aid with genome editing of human and mouse genomes
vector arts for life sciences
- biorender
- The Noun Project
- reactome icon
- Inovative genomic Institute glossary\
- https://smart.servier.com/category/cellular-biology/nucleic-acids/
- https://www.vecteezy.com/
- https://www.freepik.com/
- https://pixabay.com/