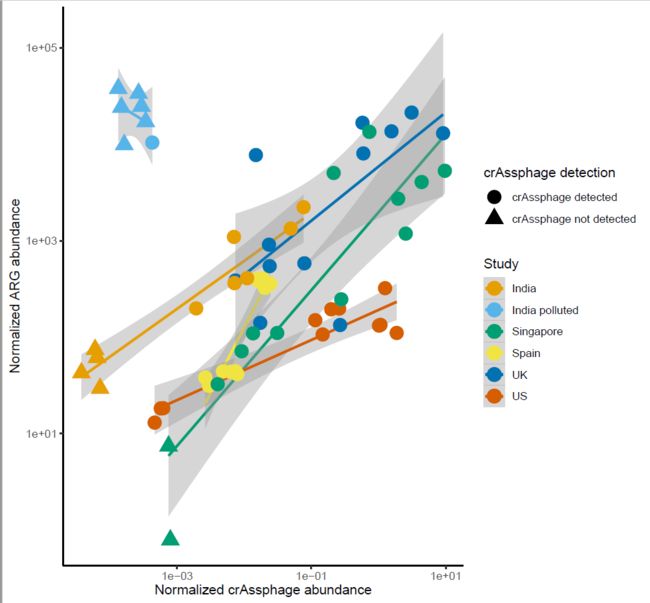
今天继续 跟着Nature Communications学画图系列第四篇。学习R语言ggplot2包画散点图,然后分组添加拟合曲线。对应的是论文中的Figure2
对应的 Nature Communications 的论文是 Fecal pollution can explain antibiotic resistance gene abundances in anthropogenically impacted environments
这篇论文数据分析和可视化的部分用到的数据和代码全部放到了github上 https://github.com/karkman/crassphage_project
非常好的R语言学习素材。
首先是读入数据、查看数据维度
crass_impact <- read.table("data/crass_impact.txt")
dim(crass_impact)
head(crass_impact)
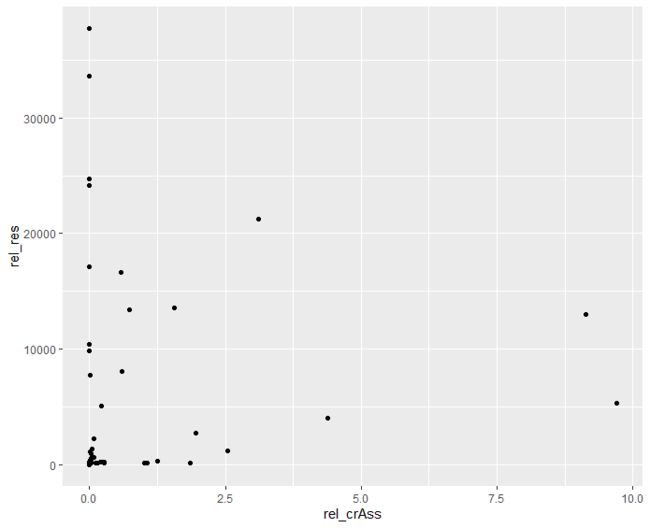
最基本的散点图
ggplot(crass_impact,aes(x=rel_crAss,y=rel_res))+
  geom_point()
指定变量填充颜色
ggplot(crass_impact,aes(x=rel_crAss,y=rel_res,color=country))+
  geom_point()
自定义颜色值
cols <- c("#E69F00", "#56B4E9", "#009E73", "#F0E442", "#0072B2", "#D55E00")
ggplot(crass_impact,aes(x=rel_crAss,y=rel_res,color=country))+
  geom_point()+
  scale_color_manual(values = cols)
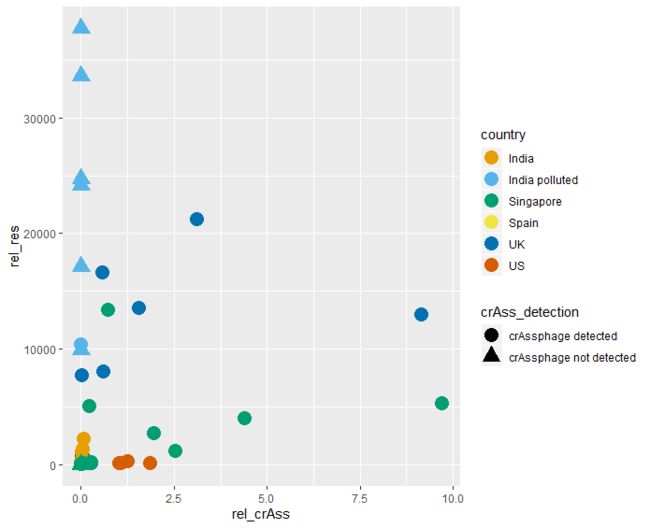
根据指定变量映射点的形状,并改变点的大小
ggplot(crass_impact,aes(x=rel_crAss,y=rel_res,color=country))+
  geom_point(aes(shape=crAss_detection),size=5)+
  scale_color_manual(values = cols)
添加拟合曲线
ggplot(crass_impact,aes(x=rel_crAss,y=rel_res,color=country))+
  geom_point(aes(shape=crAss_detection),size=5)+
  scale_color_manual(values = cols)+
  geom_smooth(method = 'lm')
分别对x和y取log10进行转换
ggplot(crass_impact,aes(x=rel_crAss,y=rel_res,color=country))+
  geom_point(aes(shape=crAss_detection),size=5)+
  scale_color_manual(values = cols)+
  geom_smooth(method = 'lm')+
  scale_x_log10()+
  scale_y_log10()
更改作图的主题
ggplot(crass_impact,aes(x=rel_crAss,y=rel_res,color=country))+
  geom_point(aes(shape=crAss_detection),size=5)+
  scale_color_manual(values = cols)+
  geom_smooth(method = 'lm')+
  scale_x_log10()+
  scale_y_log10()+
  theme_classic()
更改x轴、y轴的标题
ggplot(crass_impact,aes(x=rel_crAss,y=rel_res,color=country))+
  geom_point(aes(shape=crAss_detection),size=5)+
  scale_color_manual(values = cols)+
  geom_smooth(method = 'lm')+
  scale_x_log10()+
  scale_y_log10()+
  theme_classic()+
  labs(y = "Normalized ARG abundance",
       x="Normalized crAssphage abundance")
更改图例的标题
ggplot(crass_impact,aes(x=rel_crAss,y=rel_res,color=country))+
  geom_point(aes(shape=crAss_detection),size=5)+
  scale_color_manual(values = cols)+
  geom_smooth(method = 'lm')+
  scale_x_log10()+
  scale_y_log10()+
  theme_classic()+
  labs(y = "Normalized ARG abundance",
       x="Normalized crAssphage abundance",
       color="Study",
       shape="crAssphage detection")
这里注意到更改图例的标题以后图例的顺序也变了。原来图例的默认顺序也是按照首字母排序来的。
还想改图中的哪些地方可以留言讨论
欢迎大家关注我的公众号
小明的数据分析笔记本


