- 数据(Data)和映射(Mapping)
- 几何图形
- 标尺(Scale)
- 统计变换(Statistics)
- 坐标系统(Coordinante)
- 图层(Layer)
- 分面(Facet)
- 主题 (theme)
- 输入输出
1. 数据(Data)和映射(Mapping)
- ggplot(): 创建一个坐标系,可以在上面添加图层
- 颜色类型映射:包括 color(颜色或边框颜色)、fill(填充颜色)和 alpha(透明度)
- 形状类型映射:包括 linetype(线型)、size(点的大小或线的宽度)和 shape(形状)
- 位置类型映射:包括 x, y, xmin, xmax, ymin, ymax, xend, yend
- 特殊类型:包括两类,一类是指定数据分组和顺序的映射group和order,另一类是字符串映射。
2. geom_xxx(): 几何图层
| geom | stat | aes |
|---|---|---|
| geom_abline | abine | colour,linetype,size |
| geom_area | identity | colour,fill,linetype,size,x,y |
| geom_bar | bin | colour,fill,linetype,size,weight,x |
| geom_bin2d | bin2d | colour,fill,linetype,size,weight,xmax,xmin,ymax,ymin |
| geom_blank | identity | |
| geom_boxplot | boxplot | colour,fill,lower,middle,size,upper,weight,x,ymax.ymin |
| geom_contour | contour | colour,linetype,size,weight,x |
| geom_crossbar | identity | colour,fill,linetype,size,x,y,ymax,ymin |
| geom_density | density | colour,fill,linetype,size,weight,x,y |
| geom_density2d | density2d | colour,linetype,size,weight,x,y |
| geom_dotplot | bindot | colour,fill,x,y |
| geom_errorbar | identity | colour,linetype,size,width,x,ymax,ymin |
| geom_errorbarh | identity | colour,linetype,size,width,x,ymax,ymin |
| geom_freqpoly | bin | colour,linetype,size |
| geom_hex | binhex | colour,fill,size,x,y |
| geom_histogram | bin | colour,fill,linetype,size,weight,x |
| geom_hline | hline | colour,linetype,size |
| geom_jitter | identity | colour,fill,shape,size,x,y |
| geom_line | identity | colour,linetype,size,x,y |
| geom_linerange | identity | colour,linetype,size,size,x,ymax,ymin这个grom_linerange函数可以实现批量美学映射,包含线条颜色自定义、粗细自定义、线型自定义以及线条上下边界的自定义,通过coord_flip函数还可以将垂直线的所有应用转化为水平线应用,非常方便。 |
| geom_map | identity | colour,fill,linetype,size,x,y,map_id |
| geom_path | identity | colour,linetype,size,x,y |
| geom_point | identity | colour,fill,shape,size,x,y |
| geom_pointrange | identity | colour,fill,linetype,shape,size,x,ymax,ymin |
| geom_polygon | identity | colour,fill,linetype,size,x,y 什么东西都是用尽可能多的点来拟合 |
| geom_quantile | quantile | colour,linetype,size,weight,x,y |
| geom_raster | identity | colour,fill,linetype,size,x,y |
| geom_rect | identity | colour,fill,linetype,size,xmax,xmin,ymax,ymin自定义矩阵 |
| geom_ribbon | identity | colour,fill,linetype,size,x,ymax,ymin |
| geom_rug | identity | colour,linetype,size |
| geom_segment | identity | colour,linetype,size,x,xend.y.yend;geom_segment通常用于制作直线段图,路径图、放射线图等,思路也很简单,只需要指定每一条线段的起点坐标、终点坐标即可。 |
| geom_smooth | smooth | aplha,colour,fill,linetype,size,weight,x,y |
| geom_step | identity | colour,linetype,size,x,y |
| geom_text | identity | angle,colour,hjust,label,size,size,vjust,x,y |
| geom_tile | identity | colour,fill,linetype,size,x,y |
| geom_violin | ydensity | weigth,colour,fill,size,linetype,x,y |
| geom_vline | vline | colour,linetype,size |
- position:位置调整,有效值是stack、dodge和fill,默认值是stack(堆叠),是指两个条形图堆叠摆放,dodge是指两个条形图并行摆放,fill是指按照比例来堆叠条形图,每个条形图的高度都相等,但是高度表示的数量是不尽相同的。
- stat(统计转换)参数设置为'identity',即对原始数据集不作任何统计变换,而该参数的默认值为'count',即观测数量。
3. 标尺(Scale)
https://www.zybuluo.com/K1999/note/426338
### 线条颜色
> scalexx <- scalex[grepl("scale_color.+", scalex)]
> unique(gsub("(([^_]+_){2})(.+)", "\\3", scalexx))
 [1] "brewer"     "continuous" "discrete"   "distiller"  "gradient"   "gradient2"
 [7] "gradientn"  "grey"       "hue"        "identity"   "manual"
### 填充色
> scalexx <- scalex[grepl("scale_fill.+", scalex)]
> unique(gsub("(([^_]+_){2})(.+)", "\\3", scalexx))
 [1] "brewer"     "continuous" "date"       "datetime"   "discrete"   "distiller"
 [7] "gradient"   "gradient2"  "gradientn"  "grey"       "hue"        "identity"
[13] "manual"
### 大小
> scalexx <- scalex[grepl("scale_size.+", scalex)]
> unique(gsub("(([^_]+_){2})(.+)", "\\3", scalexx))
[1] "area"       "continuous" "date"       "datetime"   "discrete"   "identity"
[7] "manual"
### 透明度
> scalexx <- scalex[grepl("scale_alpha.+", scalex)]
> unique(gsub("(([^_]+_){2})(.+)", "\\3", scalexx))
[1] "continuous" "discrete"   "identity"   "manual"
### 线型
> scalexx <- scalex[grepl("scale_linetype.+", scalex)]
> unique(gsub("(([^_]+_){2})(.+)", "\\3", scalexx))
[1] "continuous" "discrete"   "identity"   "manual"
### 形状
> scalexx <- scalex[grepl("scale_shape.+", scalex)]
> unique(gsub("(([^_]+_){2})(.+)", "\\3", scalexx))
[1] "continuous" "discrete"   "identity"   "manual"
### x轴
> scalexx <- scalex[grepl("scale_x.+", scalex)]
> unique(gsub("(([^_]+_){2})(.+)", "\\3", scalexx))
[1] "continuous" "date"       "datetime"   "discrete"   "log10"      "reverse"
[7] "sqrt"
### y轴
> scalexx <- scalex[grepl("scale_y.+", scalex)]
> unique(gsub("(([^_]+_){2})(.+)", "\\3", scalexx))
[1] "continuous" "date"       "datetime"   "discrete"   "log10"      "reverse"
[7] "sqrt"
4. 统计变换(Statistics)
- stat_smooth
stat_smooth(
  mapping = NULL,
  data = NULL,
  geom = "smooth",
  position = "identity",
  ...,
  method = NULL,
  formula = NULL,
  se = TRUE,
  n = 80,
  span = 0.75,
  fullrange = FALSE,
  level = 0.95,
  method.args = list(),
  na.rm = FALSE,
  orientation = NA,
  show.legend = NA,
  inherit.aes = TRUE
)
| mapping | Set of aesthetic mappings created by aes() or aes_(). If specified and inherit.aes = TRUE (the default), it is combined with the default mapping at the top level of the plot. You must supply mapping if there is no plot mapping. | |
| data | ||
| method | Smoothing method (function) to use, accepts either NULL or a character vector, e.g. "lm", "glm", "gam", "loess" or a function, e.g. MASS::rlm or mgcv::gam, stats::lm, or stats::loess. "auto" is also accepted for backwards compatibility. It is equivalent to NULL.For method = NULL the smoothing method is chosen based on the size of the largest group (across all panels). stats::loess() is used for less than 1,000 observations; otherwise mgcv::gam() is used with formula = y ~ s(x, bs = "cs") with method = "REML". Somewhat anecdotally, loess gives a better appearance, but is O(N^2) in memory, so does not work for larger datasets. | If you have fewer than 1,000 observations but want to use the same gam() model that method = NULL would use, then set method = "gam", formula = y ~ s(x, bs = "cs"). |
| formula | Formula to use in smoothing function, eg. y ~ x, y ~ poly(x, 2), y ~ log(x). NULL by default, in which case method = NULL implies formula = y ~ x when there are fewer than 1,000 observations and formula = y ~ s(x, bs = "cs") otherwise. |
5. 坐标系统(Coordinante)
- 1 交换X轴和Y轴
- 使用coord_flip()来翻转坐标轴。
ggplot(PlantGrowth, aes(x=group, y=weight)) + geom_boxplot() + coord_flip()
- 2 设置连续型坐标轴的值域
可以使用xlim()和ylim()来设置连续型坐标轴的最小值和最大值。
ggplot(PlantGrowth, aes(x=group, y=weight)) + geom_boxplot() + ylim(0, max(PlantGrowth$weight))
- ylim()是scale_y_continuous()的简化写法,后者还可以使用breaks设置刻度线的位置。
ylim(0,  10)

scale_y_continuous(limits=c(0,  10),  breaks=c(0,  5,  10))
- 3 反转连续型坐标轴
使用scale_y_reverse()和scale_x_reverse()反转连续型坐标轴。
- 4 修改类别型坐标轴上项目的顺序
通过scale_x_discrete()和scale_y_discrete()并将一个依所需顺序排列的水平向量传递给limits即可。如果在limits中省略某一类别对应的值,则该类别在绘图中将不显示。
ggplot(PlantGrowth, aes(x=group, y=weight)) + geom_boxplot() + scale_x_discrete(limits=c("trt1", "ctrl", "trt2"))
以下代码反转类别型坐标轴的项目顺序。
ggplot(PlantGrowth, aes(x=group, y=weight)) + geom_boxplot() + scale_x_discrete(limits=rev(levels(PlantGrowth$group)))
5 设置X轴和Y轴的缩放比例
当x轴和y轴所对应的连续型变量具有相同的尺度和量级时,可以通过coord_fixed()使得x轴和y轴之间保持1:1的缩放结果。
library(gcookbook)

ggplot(marathon,  aes(x=Half,  y=Full))  +  geom_point()  +  coord_fixed()
如果希望使用其他缩放比例时,在coord_fixed()中指定ratio即可。
ggplot(marathon, aes(x=Half, y=Full)) + geom_point() + coord_fixed(ratio=1/2)
6 修改刻度标签的文本
在需要设置刻度标签的地方同时为breaks和labels赋值即可。
library(gcookbook)

ggplot(heightweight,  aes(x=ageYear,  y=heightIn))  +  geom_point()  +  scale_y_continuous(breaks=c(50,  56,  60,  66,  72),  labels=c("Tiny",  "Really\nshort",  "Short",  "Medium",  "Tallish"))
也可以定义一个格式化函数,将原始的值自动地转换为相应的标签。
# 将英寸转换为英尺加英寸

footinch_formatter  <-  function(x)  {

    foot  <-  floor(x/12)

    inch  <-  x  %%  12

    return(paste(foot,  "'",  inch,  "\"",  sep=""))

}

ggplot(heightweight,  aes(x=ageYear,  y=heightIn))  +  geom_point()  +  scale_y_continuous(labels=footinch_formatter)
scales包提供了一些常用的格式化函数:
- comma(),在千、百万、十亿等位置向数字添加逗号;
- dollar(),添加一个美元符号并舍入到最接近的美分;
- percent(),乘以100,舍入到最接近的整数值,并添加一个百分号;
- scientific(),对大数字和小数字给出科学计数法表示。
除此之外,通过ggplot2提供的theme()可以对刻度标签文本设置字体、样式、大小和颜色,进行旋转和平移等操作,当然还包括对坐标轴标签文本、标题、图例等全部元素的样式自定义,详情请参考?theme。
7 修改标题和坐标轴标签文本
使用labs()可以同时设置x轴标签、y轴标签和标题,如果使用到了中文,还需要用theme()设置全局字体,参考这里。
labs(x="x轴标签", y="y轴标签", title="绘图标题")
8 使用对数坐标轴
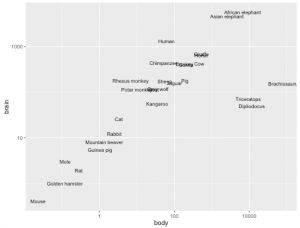
使用scale_x_log10()和scale_y_log10()可以将线性坐标轴转换为对数坐标轴,在某些情况下,使用对数坐标轴更有意义。
library(MASS)

ggplot(Animals,  aes(x=body,  y=brain,  label=rownames(Animals)))  +  geom_text(size=3)  +  scale_x_log10()  +  scale_y_log10()
9 绘制极坐标
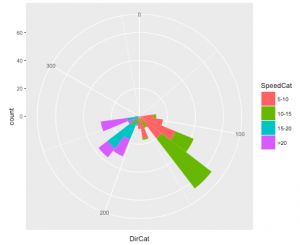
使用coord_polar()即可绘制极坐标。
library(gcookbook)

ggplot(wind,  aes(x=DirCat,  fill=SpeedCat))  +  geom_histogram(binwidth=15,  boundary=-7.5)  +  coord_polar()  +  scale_x_continuous(limits=c(0,  360))
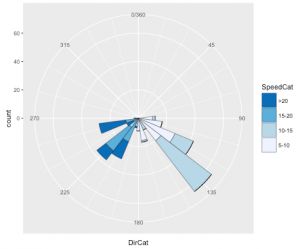
然而,由于极坐标的原因,扇形大小并不能直观反映出实际的观测数量,而且多种颜色混杂难以让人对风力有直观的感受,因此我们需要改变一下样式。
ggplot(wind, aes(x=DirCat, fill=SpeedCat)) + geom_histogram(binwidth=15, boundary=-7.5, color="black", size=.2) + guides(fill=guide_legend(reverse=TRUE)) + coord_polar() + scale_x_continuous(limits=c(0, 360), breaks=seq(0, 360, by=45), minor_breaks=seq(0, 360, by=15)) + scale_fill_brewer()
6. 图层(Layer)
7. 分面(Facet)
facet_wrap(facets, nrow = NULL, ncol = NULL, scales = "fixed",
           shrink = TRUE, as.table = TRUE, drop = TRUE)
| facets: | 分面参数如 ~cut,表示用 cut 变量进行数据分类 |
| nrow: | 绘制图形的行数 |
| ncol: | 绘制图形的列数,一般nrow/ncol只设定一个即可 |
| scales: | 坐标刻度的范围,可以设定四种类型。fixed 表示所有小图均使用统一坐标范围;free表示每个小图按照各自数据范围自由调整坐标刻度范围;free_x为自由调整x轴刻度范围;free_y为自由调整y轴刻度范围。 |
| shrinks: | 也和坐标轴刻度有关,如果为TRUE(默认值)则按统计后的数据调整刻度范围,否则按统计前的数据设定坐标。 |
| as.table: | 和小图排列顺序有关的选项。如果为TRUE(默认)则按表格方式排列,即最大值(指分组level值)排在表格最后即右下角,否则排在左上角。 |
| drop: | 是否丢弃没有数据的分组,如果为TRUE(默认),则空数据组不绘图 |
facet_grid(facets, margins = FALSE, scales = "fixed", space = "fixed", shrink = TRUE,
           labeller = "label_value", as.table = TRUE, drop = TRUE)
| margins | 注意:这不是设定图形边界的参数。它是指用于分面的包含每个变量元素所有数据的数据组。 |
| space | 这个参数要配合scales使用,如果为fixed(默认),所有小图的大小都一样,如果为free/free_x/free_y,小图的大小将按照坐标轴的跨度比例进行设置 |
| labeller | 设定小图标签的 |
8. 主题(Theme)
theme(plot.title=element_text(
+face="bold.italic", size="14", color="brown"), #指定图的标题应该为粗斜体棕色14号
+axis.title=element_text(face="bold.italic", size=10, color="brown"),#轴的标题为粗斜体的棕色10
+axis.text=element_text(face="bold", size=9, color="darkblue"),#轴标签为粗体的深蓝色9号
+panel.background=element_rect(fill="white",color="darkblue"),#图片区域有白色的填充和深蓝色的边框
+panel.grid.major.y=element_line(color="grey",linetype=1),#主水平网格应该是灰色的实线
+panel.grid.minor.y=element_line(color="grey", linetype=2),#次水平网格应该是灰色的虚线
+panel.grid.minor.x=element_blank(), #垂直网格不输出
+legend.position="top") #图例展示在顶部
- labs(title="主标题",subtitle = "次标题",caption = "下标")
- 修改主标题,次标题,caption
theme(plot.title=element_text(size=20,  #尺寸
                                    face="bold",  # 加粗
                                    color="skyblue", #颜色
                                    hjust=0.5, #调整位置,正中间
                                    lineheight=1.2)) # 线高

p + theme(plot.subtitle=element_text(size=15,
                                       face="bold",
                                       color = "red",
                                       hjust=0.5),  # subtitle
            plot.caption=element_text(size=15))  # caption
- 修改坐标轴
- vjust,控制标题(或标签)和绘图之间的垂直间距。
- hjust,控制水平间距。将其设置为0.5将标题居中。
- face,设置字体(“plain”,“italic”,“bold”,“bold.italic”)
p + theme(axis.title.x=element_text(vjust=1,
                                      size=20),  # X axis title
            axis.title.y=element_text(size=10,
                                     color = "blue"),  # Y axis title
            axis.text.x=element_text(size=10,
                                     angle = 45,
                                     color = "red",
                                     vjust=.5),  # X axis text
            axis.text.y=element_text(size=10))  # Y axis text
- 修改图例
p + theme(legend.title = element_text(size=15, color = "firebrick"),
           legend.text = element_text(size=10),
           legend.key=element_rect(fill='green'))
- 删除图例和更改图例位置
# No legend --------------------------------------------------
p + theme(legend.position="None") + labs(subtitle="No Legend")
# legend at the bottom and horizontal ------------------------
p + theme(legend.position="bottom", legend.box = "horizontal") + labs(subtitle="Legend bottom")
# legend at bottom-right, inside the plot --------------------
p + theme(legend.title = element_text(size=12, color = "salmon", face="bold"),
legend.justification=c(1,0),
legend.position=c(0.95, 0.05),
legend.background = element_blank(),
legend.key = element_blank()) +
labs(subtitle="Legend: Bottom-Right Inside the Plot")
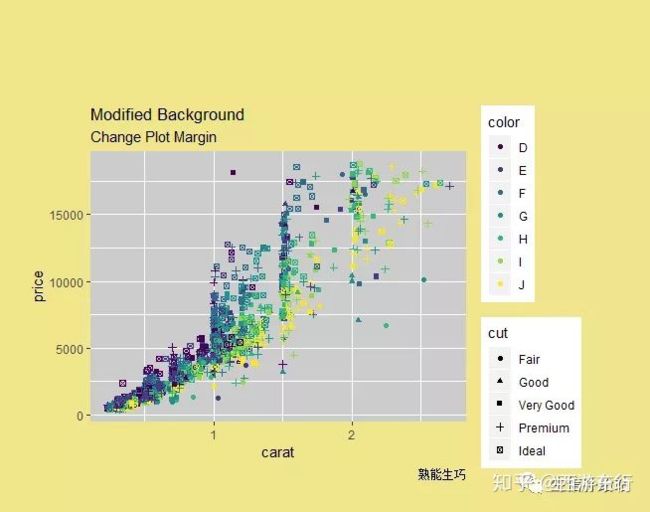
- 更改绘图背景
# 更改绘图背景和绘图区域
p + theme(panel.background = element_rect(fill = 'grey80'),
          plot.background=element_rect(fill="khaki"),
          plot.margin = unit(c(3, 2, 1, 1), "cm")) +  #设置绘图区域距离边的据类,上,右,下,左
    labs(title="Modified Background", subtitle="Change Plot Margin")
- 更改主次网格线以及X,Y坐标轴
p + theme(
          panel.grid.major = element_line(colour = "burlywood", size=1.5),
          panel.grid.minor = element_line(colour = "tomato",
                                          size=0.25,
                                          linetype = "dashed"),
          panel.border = element_blank(),
          axis.line.x = element_line(colour = "darkorange",
                                     size=1.5,
                                     lineend = "butt"),
          axis.line.y = element_line(colour = "skyblue",
                                     size=1.5)) +
    labs(
         subtitle="Change Major and Minor grid, Axis Lines")
- 删除主,次网格线,边框,轴标题,文本和刻度
p + theme(panel.grid.major = element_blank(), #主网格线
          panel.grid.minor = element_blank(), #次网格线
          panel.border = element_blank(), #边框
          axis.title = element_blank(),  #轴标题
          axis.text = element_blank(), # 文本
          axis.ticks = element_blank()) +
  labs(title="Modified Background", subtitle="Remove major and minor axis grid, border, axis title, text and ticks")
mytheme <- theme(plot.title=element_text(
+face="bold.italic", size="14", color="brown"), #指定图的标题应该为粗斜体棕色14号
+axis.title=element_text(face="bold.italic", size=10, color="brown"),#轴的标题为粗斜体的棕色10
+axis.text=element_text(face="bold", size=9, color="darkblue"),#轴标签为粗体的深蓝色9号
+panel.background=element_rect(fill="white",color="darkblue"),#图片区域有白色的填充和深蓝色的边框
+panel.grid.major.y=element_line(color="grey",linetype=1),#主水平网格应该是灰色的实线
+panel.grid.minor.y=element_line(color="grey", linetype=2),#次水平网格应该是灰色的虚线
+panel.grid.minor.x=element_blank(), #垂直网格不输出
+legend.position="top") #图例展示在顶部
theme_gray() # 默认
theme_bw()
theme_linedraw()
theme_light()
theme_dark()
theme_minimal()
theme_classic()
theme_void()
R|ggplot2(六)|套用主题模板
- theme 函数
| 参数 | 设置内容 | 继承自 |
|---|---|---|
| line | 所有线属性 | |
| rect | 所有矩形区域属性 | |
| text | 所有文本相关属性 | |
| title | 所有标题属性 | |
| axis.title | 坐标轴标题 | text |
| axis.title.x | x轴属性 | axis.title |
| axis.title.y | y轴属性 | axis.title |
| axis.text | 坐标轴刻度标签属性 | text |
| axis.text.x | 属性和继承和前面类似,不再重复 | |
| axis.text.y | ||
| axis.ticks | 坐标轴刻度线 | line |
| axis.ticks.x | ||
| axis.ticks.y | ||
| axis.ticks.length | 刻度线长度 | |
| axis.ticks.margin | 刻度线和刻度标签之间的间距 | |
| axis.line | 坐标轴线 | line |
| axis.line.x | ||
| axis.line.y | ||
| legend.background | 图例背景 rect | |
| legend.margin | 图例边界 | |
| legend.key | 图例符号 | |
| legend.key.size | 图例符号大小 | |
| legend.key.height | 图例符号高度 | |
| legend.key.width | 图例符号宽度 | |
| legend.text | 图例文字标签 | |
| legend.text.align | 图例文字标签对齐方式 0为左齐,1为右齐 | |
| legend.title | 图例标题 text | |
| legend.title.align | 图例标题对齐方式 | |
| legend.position | 图例位置 left, right, bottom, top, 两数字向量 | |
| legend.direction | 图例排列方向 "horizontal" or "vertical" | |
| legend.justification | 居中方式 center或两数字向量 | |
| legend.box | 多图例的排列方式 "horizontal" or "vertical" | |
| legend.box.just | 多图例居中方式 | |
| panel.background | 绘图区背景 | rect |
| panel.border | 绘图区边框 | rect |
| panel.margin | 分面绘图区之间的边距 | |
| panel.grid | 绘图区网格线 | line |
| panel.grid.major | 主网格线 | |
| panel.grid.minor | 次网格线 | |
| panel.grid.major.x | ||
| panel.grid.major.y | ||
| panel.grid.minor.x | ||
| panel.grid.minor.y | ||
| plot.background | 整个图形的背景 | |
| plot.title | 图形标题 | |
| plot.margin | 图形边距 top, right, bottom, left | |
| strip.background | 分面标签背景 | rect |
| strip.text | 分面标签文本 | text |
| strip.text.x | ||
| strip.text.y |
9. 储存和输出
- 将myplot保存为名为mygraph.png的5英寸*4英寸PNG格式的图片
myplot<-ggplot(data=mtcars,aes(x=mpg))+geom_histogram()
ggsave(file="mygraph.png",plot=myplot,width=5,height=4)


