基础算法-逻辑回归
逻辑回归算法原理介绍
回归和分类的概念
回归----预测的值为连续的值,如预测房价
分类----预测的值为分类变量,如预测好人还是坏人
逻辑回归的概念
实际上是一种分类方法
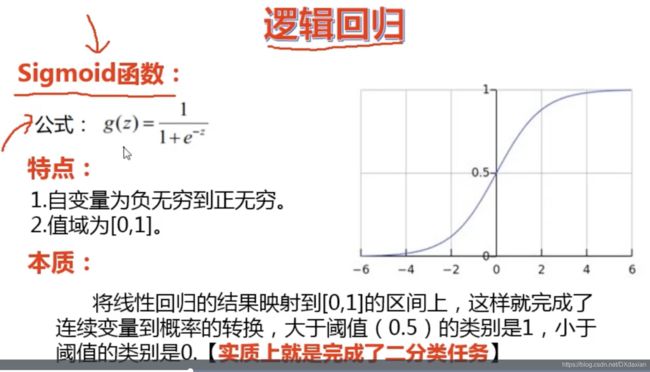
逻辑回归的核心函数:sigmoid函数
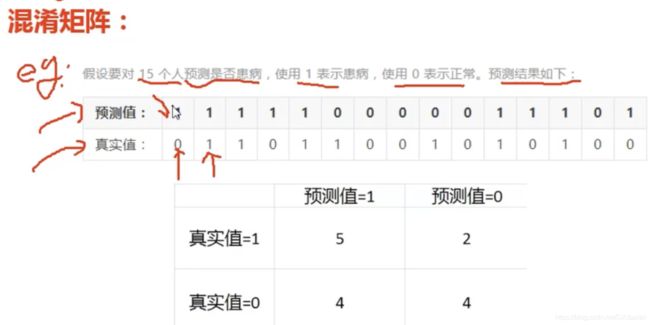
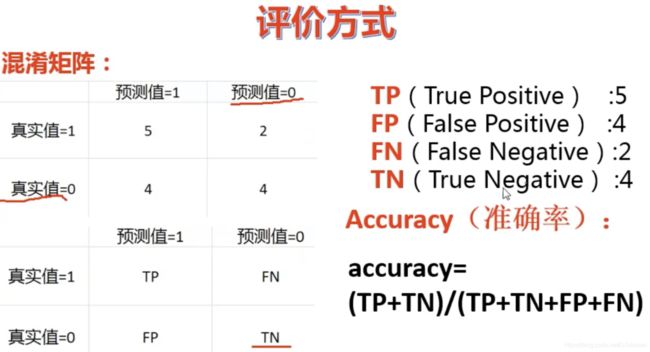
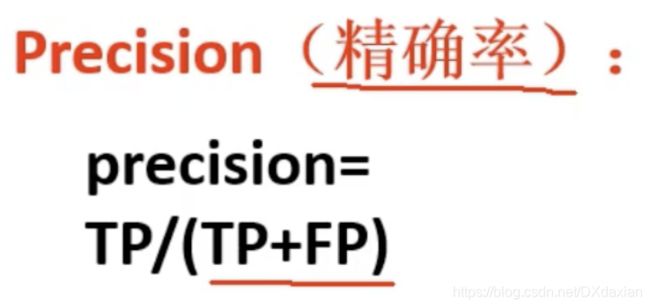
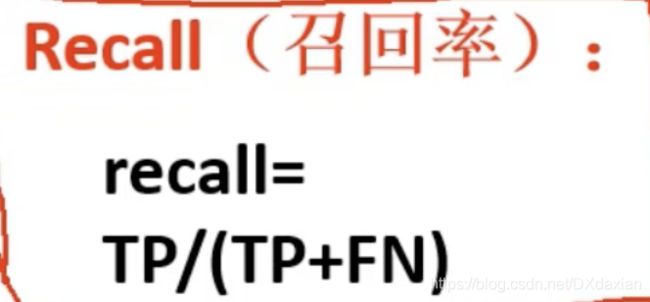
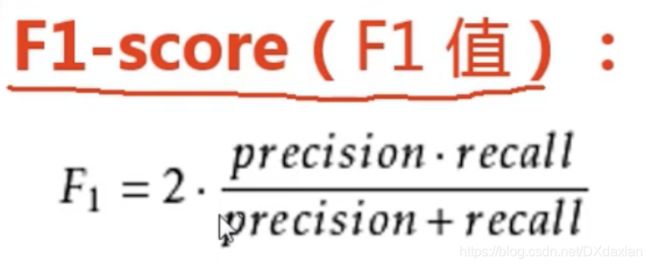
模型评估方法
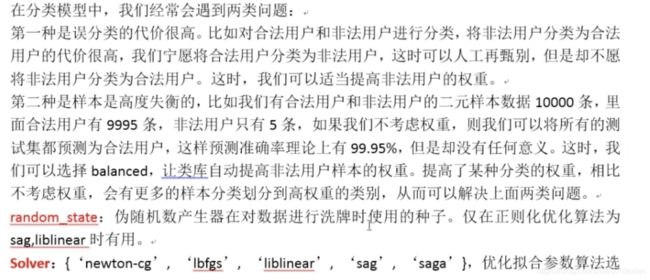
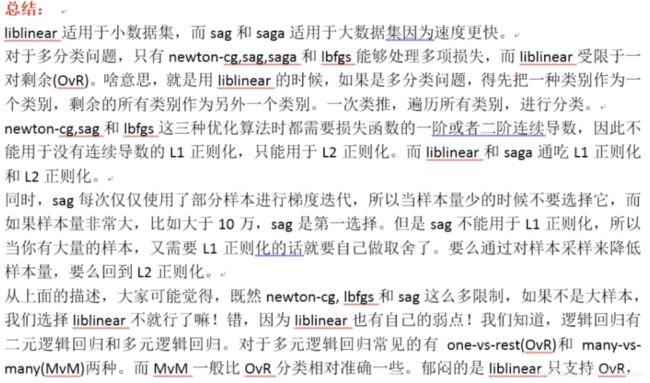
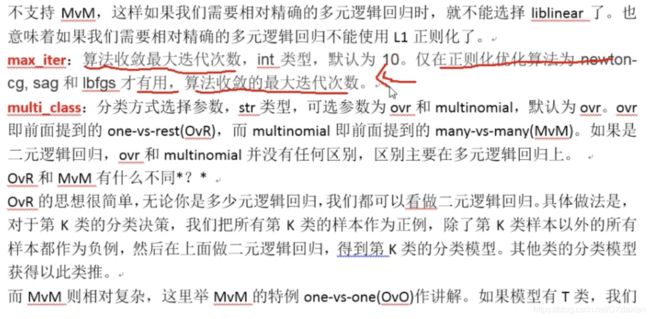
逻辑回归API参数详解
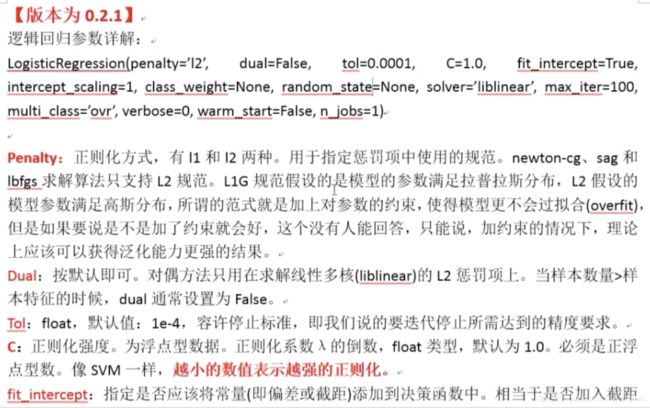
tol:由于在梯度下降中不断迭代θ,去寻找最小值,在曲线谷底会来回徘徊,可以容忍的精度偏差就是tol,在这个位置偏差位置取出θ,一般都是按默认
代码实战
鸢尾花案例详解
"""
鸢尾花案例详解(一)
train_data:训练集,专门用来训练模型,【相当于测试题和模考】
test_data:测试集,用来测试模型【相当于高考】
"""
import pandas as pd
train_data = pd.read_excel(r'/Users/dx/Desktop/Python数据分析与机器学习/6.逻辑回归/鸢尾花案例/鸢尾花训练数据.xlsx')
test_data = pd.read_excel(r'/Users/dx/Desktop/Python数据分析与机器学习/6.逻辑回归/鸢尾花案例/鸢尾花测试数据.xlsx')

'''
处理训练集数据:
数据重排,变量和标签分离
'''
#train_data.columns#直接打印出来用于列名复制,防止打字出错
train_x = train_data[['萼片长(cm)', '萼片宽(cm)', '花瓣长(cm)', '花瓣宽(cm)']]
train_y = train_data[['类型_num']]

'''
生成逻辑回归对象,并对训练集进行训练
'''
from sklearn.linear_model import LogisticRegression
model = LogisticRegression()
model.fit(train_x,train_y)

'''
使用训练集数据查看 训练效果
绘制混淆矩阵;可视化混淆矩阵
'''
train_predicted = model.predict(train_x)

from sklearn import metrics
#绘制混淆矩阵 support:样本数量
print(metrics.classification_report(train_y,train_predicted))

#可视化混淆矩阵 (不必掌握)
def cm_plot(y,yp):
    from sklearn.metrics import confusion_matrix
    import matplotlib.pyplot as plt

    cm = confusion_matrix(y, yp)
    plt.matshow(cm, cmap=plt.cm.Blues)
    plt.colorbar()
    for x in range(len(cm)):
        for y in range(len(cm)):
            plt.annotate(cm[x,y],xy=(y,x),horizontalalignment='center',
                         verticalalignment='center')
            plt.ylabel('True label')
            plt.xlabel('Predicted label')
    return plt

cm_plot(train_y, train_predicted).show()

'''
使用测试集测试,防止过拟合:防止模拟题做的很好,高考考不好
'''
test_x = test_data[['萼片长(cm)', '萼片宽(cm)', '花瓣长(cm)', '花瓣宽(cm)']]
test_y = test_data[['类型_num']]
#测试结果
test_predicted = model.predict(test_x)
print(metrics.classification_report(test_y,test_predicted))

'''
进行预测
'''
#预测概率
predicted_data = pd.read_excel(r'/Users/dx/Desktop/Python数据分析与机器学习/6.逻辑回归/鸢尾花案例/鸢尾花预测数据.xlsx')
pr_X = predicted_data[['萼片长(cm)', '萼片宽(cm)', '花瓣长(cm)', '花瓣宽(cm)']]

#预测结果
predicted = model.predict(pr_X)

 #预测概率
predicted_pr = model.predict_proba(pr_X)#大于0.5判定为1,小于0.5判定为0
贷款风险评估案例
数据预处理->数据标准化->切分数据成train和test
交叉验证
总体数据切分成成train和test集后,在训练集基础上再划分出验证集,训练集训练模型,验证集调整训练后的模型,测试集测试模型的泛化能力。验证集参与模型构建,测试集不参与模型构建。
训练集数据量变少了,训练出来的模型不是更不准确了吗?
可以使用K折交叉验证
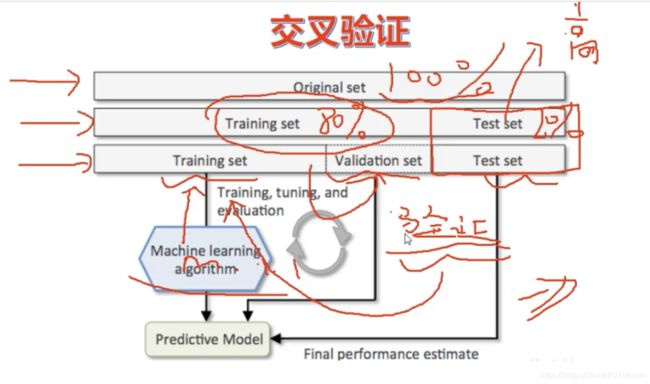
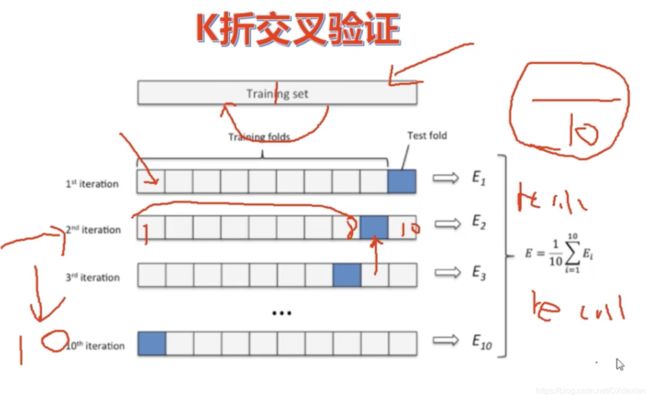
K折交叉验证
作为总数据量80%的训练集,被分成k份,以10份为例:
总数据80%的训练集等分为10份,分成多少分就是多少折的交叉验证。
第一次用前9份训练model,第10份验证model,取得socre参数,如recall
第二次用第9份验证model,其他份训练model
依次类推,经过10次,每一份都被用来验证model过了
将每次取得的参数加和后除以10
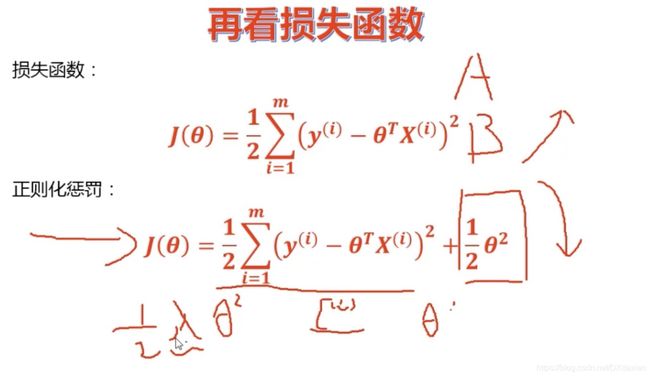
正则化惩罚
解释:
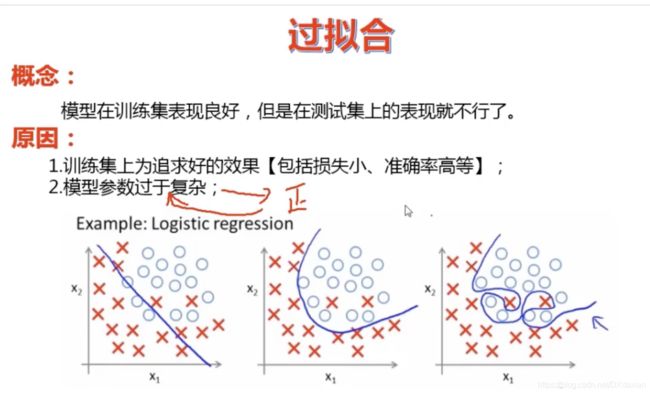
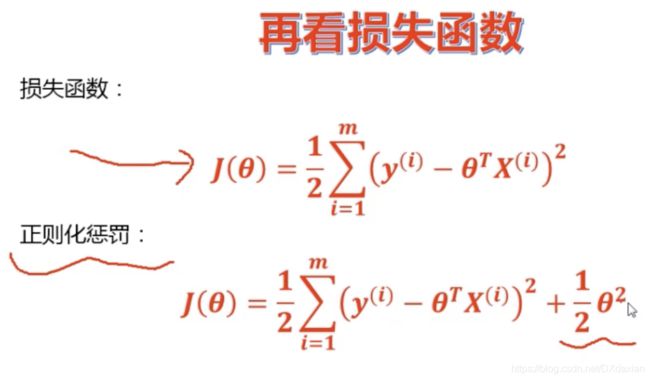
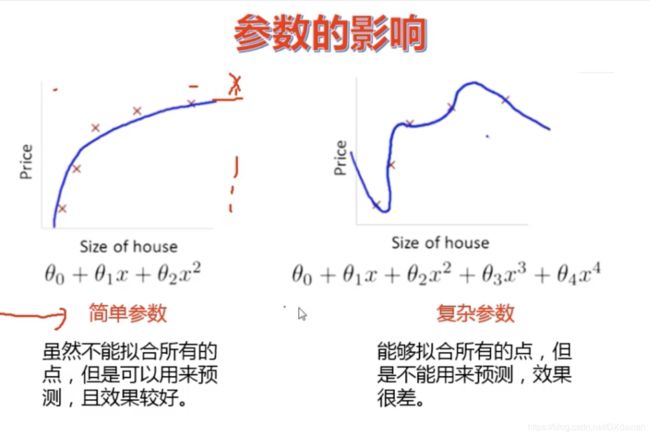
过拟合产生的原因通常是因为参数比较大导致的,通过添加正则项,假设某个参数比较大,目标函数加上正则项后,也就会变大,因此该参数就不是最优解了。
问:为什么过拟合产生的原因是参数比较大导致的?
答:过拟合,就是拟合函数需要顾忌每一个点,当存在噪声的时候,原本平滑的拟合曲线会变得波动很大。在某些很小的区间里,函数值的变化很剧烈,这就意味着函数在某些小区间里的导数值(绝对值)非常大,由于自变量值可大可小,所以只有系数足够大,才能保证导数值很大。
L2正则化惩罚中应该增加参数:λ(θ^2)/2,λ称为惩罚力度(超参数),当A模型变化比较小,前面的损失值就小,当B模型变化大,前面的损失值就大,那么这个B模型就不好,因此加入惩罚力度λ。假设λ惩罚力度是100,那么A模型的误差值就会增加一些;B模型的误差值原来就大了,再乘以λ后则会增加很多。
L1正则化惩罚中,增加的参数是λ|θ|/2
L1正则化会尽量让θ=0
L2正则化会尽量让θ≈0
L1正则化比较好,但在实际中会有一定的问题,这个问题不太好解决
所以一般使用L2正则化
交叉验证获取超参数,即惩罚力度λ
代码
import pandas as pd
import numpy as np
import time

#可视化混淆矩阵
def cm_plot(y,yp):
    from sklearn.metrics import confusion_matrix
    import matplotlib.pyplot as plt

    cm = confusion_matrix(y, yp)
    plt.matshow(cm, cmap=plt.cm.Blues)
    plt.colorbar()
    for x in range(len(cm)):
        for y in range(len(cm)):
            plt.annotate(cm[x,y],xy=(y,x),horizontalalignment='center',
                         verticalalignment='center')
            plt.ylabel('True label')
            plt.xlabel('Predicted label')
    return plt

"""
数据预处理
"""
data = pd.read_excel(r"/Users/dx/Desktop/Python数据分析与机器学习/6.逻辑回归/贷款风险用户识别案例/data.xls")
data.head()#打印前五行

"""
数据标准化:Z标准化
"""
#对原始数据集变量与标签分离
X_whole = data.drop('还款拖欠情况', axis=1)
y_whole = data.还款拖欠情况

"""
切分数据集
"""
from sklearn.model_selection import train_test_split

x_train_w, x_test_w, y_train_w, y_test_w = \
    train_test_split(X_whole, y_whole, test_size = 0.2, random_state = 0)
#test_size测试集的比例在20%-30%左右,要给训练集多留一些数据
#random_state = 0 ,随机状态,每次运行后训练集、测试集的数据相同,防止因为数据不同而造成模型的变化


"""
执行交叉验证操作
scoring:可选“accuracy”(精度)、recall(召回率)、roc_auc(roc值)
        neg_mean_squared_error(均方误差)、
"""

from sklearn.linear_model import LogisticRegression
from sklearn.model_selection import cross_val_score
#sklearn.model_selection中导入cross_val_score类就能进行交叉验证

#交叉验证选择较优惩罚因子
scores = []
c_param_range = [0.01,0.1,1,10,100]#定义超参数,惩罚因子
#使用每一个超参数去试验,看一看最终模型的结果哪一个更好
z = 1
for i in c_param_range:
    start_time = time.time()#现在数据量比较小,但是数据量大时,记录下时间,便于代码调试
    #C正则化惩罚因子,penalty正则化方式
    lr = LogisticRegression(C = i, penalty = 'l2', solver='lbfgs')
    #score交叉验证的值,cv=10:10折交叉验证,计算参数recall,返回recall值
    #当数据量更大时,可以使用更多折的交叉验证
    score = cross_val_score(lr, x_train_w, y_train_w, cv=10, scoring='recall')
    score_mean = sum(score)/len(score)#计算均值
    scores.append(score_mean)#把不同惩罚因子的交叉验证放到列表中对比
    end_time = time.time()
    print("第{}次...".format(z))
    print("time spend:{:.2f}".format(end_time - start_time))
    print("recall值为:{}".format(score_mean))
    z +=1
#最大值是最优惩罚因子,取出最大值
best_c = c_param_range[np.argmax(scores)]
print()
print("最优惩罚因子为: {}".format(best_c))

"""
利用最优惩罚因子,建立最优模型
"""
lr = LogisticRegression(C = best_c, penalty = 'l2', solver='lbfgs')
lr.fit(x_train_w, y_train_w)

"""
训练集预测
"""
from sklearn import metrics
#训练集预测概率
train_predicted_pr = lr.predict_proba(x_train_w)
train_predicted = lr.predict(x_train_w)
print(metrics.classification_report(y_train_w, train_predicted))
#reall=0.27,100个违约的人里,只能找到27个,这个召回率是比较低的,优化方法以后课程中讲
cm_plot(y_train_w, train_predicted).show()


"""
测试集预测
"""
#预测结果
test_predicted = lr.predict(x_test_w)
#绘制混淆矩阵
print(metrics.classification_report(y_test_w, test_predicted))
cm_plot(y_test_w, test_predicted).show()
结果原因分析
结果:reall=0.27,100个违约的人里,只能找到27个,这个召回率是比较低的,这是为什么呢
原因:在总数据中,贷款违约用户的所占比例太少,构建模型用的是整个数据集合,造成了样本的不均衡,可以采用下采用、过采样解决(在下一个信用卡风险评估案例中讲解)。
样本不均衡解决方案
下采样
下采样思想:分类为0的数据:分类为1的数据=1:9,造成了样本的不均衡,那么有什么办法可以让样本变成1:1均衡的呢?下采样就是这样的方法,从0类数据中采用出和1类数据一样多的数据量,把采样数据均衡成1:1,但是测试集还是使用原数据
之前1的数据太少,机器学习到的都是0的数据,所以抓0比较准确,抓1比较不准确。
过采样
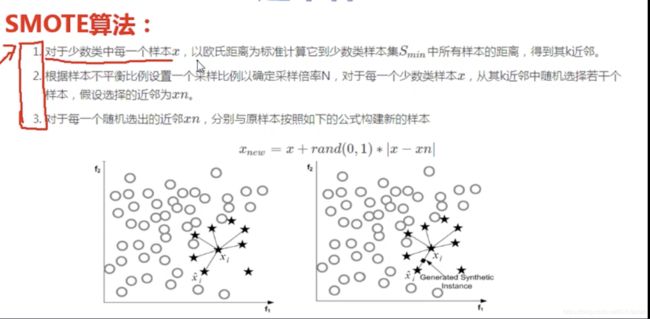
过采样思想:把1类数据变成和0类数据一样多。利用SMOTE算法生成“以假乱真”的样本,使0类数据和1类数据构成1:1。
过采样数据量更大,比下采样更优。

信用卡风险评估案例
不处理直接建模
"""
信用卡风险用户识别(不处理)
数据量很大时用notebook可以看到图,比较方便
"""
import pandas as pd
'''
数据预处理
v1-v28是经过pca降维得到的,account是和
'''
data = pd.read_csv(r'/Users/dx/Desktop/Python数据分析与机器学习/6.逻辑回归/信用卡风险用户识别/【逻辑回归数据】creditcard.csv',
                   encoding = 'utf8')
data.head()#打印前五行

'''
绘制图像,查看正负样本个数
'''
import matplotlib.pyplot as plt
from pylab import mpl
#在图中显示中文
mpl.rcParams['font.sans-serif'] = ['SimHei']
mpl.rcParams['axes.unicode_minus'] = False

labels_count = pd.value_counts(data['Class'])
plt.title('正负例样本数')
plt.xlabel('类别')
plt.ylabel('频数')
labels_count.plot(kind = 'bar')
#正常的28W,极度样本不均衡

'''
数据标准化:Z标准化
'''
from sklearn.preprocessing import StandardScaler #导入预处理包和数据标准化函数
scaler = StandardScaler()
data['Amount'] = scaler.fit_transform(data[['Amount']])#标准化
data.head()
#删除无用列
data = data.drop(['Time'],axis = 1)

'''
建模
'''
#数据切分
from sklearn.model_selection import train_test_split
X_whole = data.drop(['Class'],axis = 1)
y_whole = data.Class

x_train_w, x_test_w, y_train_w, y_test_w = \
    train_test_split(X_whole, y_whole, test_size = 0.3, random_state = 0)

#导入实例模型
from sklearn.linear_model import LogisticRegression
lr = LogisticRegression()
lr.fit(x_train_w, y_train_w)

#预测训练集结果
train_predicted = lr.predict(x_train_w)

from sklearn import metrics
#绘制混淆矩阵
print(metrics.classification_report(y_train_w,train_predicted))

#可视化混淆矩阵
def cm_plot(y,yp):
    from sklearn.metrics import confusion_matrix
    import matplotlib.pyplot as plt

    cm = confusion_matrix(y, yp)
    plt.matshow(cm, cmap=plt.cm.Blues)
    plt.colorbar()
    for x in range(len(cm)):
        for y in range(len(cm)):
            plt.annotate(cm[x,y],xy=(y,x),horizontalalignment='center',
                         verticalalignment='center')
            plt.ylabel('True label')
            plt.xlabel('Predicted label')
    return plt

cm_plot(y_train_w, train_predicted).show()#recall = 0.66

#预测训练集结果
test_predicted = lr.predict(x_test_w)
#绘制混淆矩阵
print(metrics.classification_report(y_test_w, test_predicted))

cm_plot(y_test_w, test_predicted).show()
#recall = 0.63和训练集预测结果偏差不大比较稳定,但是recall太低,识别率低了一点。
下采样建模
"""
信用卡风险用户识别(下采样)
"""
import pandas as pd
import numpy as np
import matplotlib.pyplot as plt
from pylab import mpl
'''
第一步:数据预处理
'''
data = pd.read_csv(r'/Users/dx/Desktop/Python数据分析与机器学习/6.逻辑回归/信用卡风险用户识别/【逻辑回归数据】creditcard.csv',
                   encoding = 'utf8')
data.head()#打印前五行

'''
绘制图形:查看正负样本个数
'''
#在图中显示中文
mpl.rcParams['font.sans-serif'] = ['SimHei']
mpl.rcParams['axes.unicode_minus'] = False

labels_count = pd.value_counts(data['Class'])
plt.title('正负样本数')
plt.xlabel('类别')
plt.ylabel('频数')
labels_count.plot(kind = 'bar')

'''
数据标准化:Z标准化
'''
from sklearn.preprocessing import StandardScaler
scaler = StandardScaler()
data['Amount'] = scaler.fit_transform(data[['Amount']])
data.head()
#删除无用列
data = data.drop(['Time'], axis = 1)

'''
第二步:逻辑回归模块
下采样解决样本不均衡:使用0的数据和1的数据数量相同
'''
positive_eg = data[data['Class'] == 0]#取出0的数据行并保存到positive中
negative_eg = data[data['Class'] == 1]
np.random.seed(seed = 2)#设置随机种子,使每次采样都是一样的
positive_eg = positive_eg.sample(len(negative_eg))#0的数据和1的数据一样多了

#拼接数据:concat会把同类数据放在一起,导致data_c上面一半是positive_eg,下面一半是negative_eg
data_c = pd.concat([positive_eg,negative_eg])

'''
训练集使用下采样数据,测试集使用原始数据
'''
from sklearn.model_selection import train_test_split

#下采样数据分离和切分
X = data_c.drop(['Class'],axis = 1)
y = data_c.Class

x_train, x_test, y_train, y_test = \
    train_test_split(X, y, test_size = 0.3, random_state = 0)#这时候数据就会被打乱了

#原始数据分离和切分
X_whole = data.drop(['Class'],axis = 1)
y_whole = data.Class

x_train_w, x_test_w, y_train_w, y_test_w = \
    train_test_split(X_whole, y_whole, test_size = 0.3, random_state = 0)

'''
执行交叉验证操作
scoring:可选“accuracy”(精度)、recall(召回率)、roc_auc(roc值)
        neg_mean_squared_error(均方误差)
'''
from sklearn.linear_model import LogisticRegression
from sklearn.model_selection import cross_val_score

#交叉验证选择较优惩罚因子
scores = []
c_param_range = [0.01, 0.1, 1, 10, 100]
for i in c_param_range:
    lr = LogisticRegression(C = i, penalty = 'l2', solver = 'lbfgs')
    score = cross_val_score(lr, x_train, y_train, cv = 10, scoring = 'recall')
    score_mean = sum(score)/len(score)
    scores.append(score_mean)
    print(score_mean)

best_c = c_param_range[np.argmax(scores)]
print('..........最优惩罚因子为:{}'.format(best_c))

'''
建立最优模型
'''
lr = LogisticRegression(C = best_c, penalty = 'l2')
lr.fit(x_train,y_train)

#预测结果
train_predicted = lr.predict(x_train)

#绘制混淆矩阵
from sklearn import metrics

print(metrics.classification_report(y_train,train_predicted))
#recall = 0.93还是比较高的

#可视化混淆矩阵
def cm_plot(y,yp):
    from sklearn.metrics import confusion_matrix
    import matplotlib.pyplot as plt

    cm = confusion_matrix(y, yp)
    plt.matshow(cm, cmap=plt.cm.Blues)
    plt.colorbar()
    for x in range(len(cm)):
        for y in range(len(cm)):
            plt.annotate(cm[x,y],xy=(y,x),horizontalalignment='center',
                         verticalalignment='center')
            plt.ylabel('True label')
            plt.xlabel('Predicted label')
    return plt

cm_plot(y_train, train_predicted).show()

'''
使用测试集进行测试【小测试集】,以大测试集为标准
'''
test_predicted = lr.predict(x_test)
print(metrics.classification_report(y_test,test_predicted))
print(metrics.recall_score(y_test,test_predicted))
cm_plot(y_test, test_predicted).show()

'''
使用测试集进行测试【大测试集】
'''
test_predicted_w = lr.predict(x_test_w)
print(metrics.classification_report(y_test_w, test_predicted_w))
print(metrics.recall_score(y_test_w, test_predicted_w))
cm_plot(y_test_w, test_predicted_w).show()

'''
修改逻辑回归中的阈值,默认0.5,上面的代码就是使用了默认阈值
以最优模型为例
'''
lr = LogisticRegression(C = best_c, penalty= 'l2')
lr.fit(x_train, y_train)

#设定阈值
thresholds = [0.1,0.2,0.3,0.4,0.5,0.6,0.7,0.8,0.9]
recalls = []
for i in thresholds:
    y_predicted_proba = lr.predict_proba(x_test)
    y_predicted_proba = pd.DataFrame(y_predicted_proba)
    y_predicted_proba = y_predicted_proba.drop([0],axis = 1)
    y_predicted_proba[y_predicted_proba[1] > i ] = 1
    y_predicted_proba[y_predicted_proba[1] <= i ] = 0
    cm_plot(y_test,y_predicted_proba[1]).show()
    recall = metrics.recall_score(y_test,y_predicted_proba[1])
    recalls.append(recall)
    print('Recall metric in the testing dataset: {:.3f}'.format(recall))
过采样建模
"""
信用卡风险用户识别(过采样)
"""
import pandas as pd
import numpy as np
import time
#可视化混淆矩阵
def cm_plot(y,yp):
    from sklearn.metrics import confusion_matrix
    import matplotlib.pyplot as plt

    cm = confusion_matrix(y, yp)
    plt.matshow(cm, cmap=plt.cm.Blues)
    plt.colorbar()
    for x in range(len(cm)):
        for y in range(len(cm)):
            plt.annotate(cm[x,y],xy=(y,x),horizontalalignment='center',
                         verticalalignment='center')
            plt.ylabel('True label')
            plt.xlabel('Predicted label')
    return plt

'''
数据预处理
v1-v28是经过pca降维得到的,account是和
'''
data = pd.read_csv(r'/Users/dx/Desktop/Python数据分析与机器学习/6.逻辑回归/信用卡风险用户识别/【逻辑回归数据】creditcard.csv',
                   encoding = 'utf8')
data.head()#打印前五行

'''
数据标准化:Z标准化
'''
from sklearn.preprocessing import StandardScaler
scaler = StandardScaler()
data['Amount'] = scaler.fit_transform(data[['Amount']])
data.head()
#删除无用列
data = data.drop(['Time'],axis =1)

'''
切分数据
'''
from sklearn.model_selection import train_test_split
X_whole = data.drop('Class',axis = 1 )
y_whole = data.Class
x_train_w, x_test_w, y_train_w, y_test_w  = \
train_test_split(X_whole, y_whole, test_size = 0.2, random_state = 0)

'''
进行过采样操作
'''
from imblearn.over_sampling import SMOTE
oversampler = SMOTE(random_state=0)
os_x_train, os_y_train, = oversampler.fit_sample(x_train_w,y_train_w)
len(os_y_train[os_y_train == 1])#测一下过采样数据中1类数据有多少
os_x_train = pd.DataFrame(os_x_train)
os_y_train = pd.DataFrame(os_y_train)

'''
执行交叉验证操作
scoring:可选“accuracy”(精度)、recall(召回率)、roc_auc(roc值)
        neg_mean_squared_error(均方误差)
'''
from sklearn.linear_model import LogisticRegression
from sklearn.model_selection import cross_val_score
scores = []
z =1
#交叉验证选择较优惩罚因子
c_param_range = [0.01, 0.1, 1, 10, 100]
for i in c_param_range:
    start_time = time.time()
    #构建带有惩罚因子的lr模型
    lr = LogisticRegression(C = i, penalty= 'l2', solver = 'lbfgs')
    #10折交叉验证,roc_auc也是越大越好,会返回10个roc_auc
    score = cross_val_score(lr, os_x_train, os_y_train, cv = 10, scoring = 'roc_auc')
    score_mean = sum(score)/len(score)
    scores.append(score_mean)
    end_time = time.time()
    print('第{}次试验惩罚因子'.format(z))
    print('time spend:{}'.format(end_time - start_time))
    print('roc_auc值为:{}'.format(score_mean))
    z += 1

best_c = c_param_range[np.argmax(scores)]
print('最优惩罚因子为:{}'.format(best_c))
'''
输出结果:最优惩罚因子为:100
'''
'''
建立最优模型
'''
lr = LogisticRegression(C = best_c, penalty = 'l2', solver= 'lbfgs')
lr.fit(os_x_train, os_y_train)

'''
训练集预测
'''
from sklearn import metrics
#训练集预测概率【大数据集】
train_predicted_pr = lr.predict_proba(os_x_train)
train_predicted = lr.predict(os_x_train)
print(metrics.classification_report(os_y_train,train_predicted))
cm_plot(os_y_train,train_predicted).show()

#训练集预测概率【小数据集】
train_predicted = lr.predict(x_train_w)
print(metrics.classification_report(y_train_w,train_predicted))
cm_plot(y_train_w,train_predicted).show()

#测试集预测概率
test_predicted = lr.predict(x_test_w)
print(metrics.classification_report(y_test_w,test_predicted))
cm_plot(y_test_w,test_predicted).show()
