泰坦尼克号生存分析
泰坦尼克号生存分析
-
- 1.对数据进行大概浏览以及对缺失数据的处理
- 2.描述性数据可视化
- 3.随机森林模型分析
-
- 1.进行最简单的随机森林模型测试
- 2.各个特征的重要性
- 3.和决策树进行对比
- 4.对超参数进行调优
摘要:本次分析主要对泰坦尼克号上的人员特征进行描述性统计分析,以及利 用随机森林出建立简单的预测模型。
1.对数据进行大概浏览以及对缺失数据的处理
train_data = pd.read_csv("train.csv")
test_data = pd.read_csv("test.csv")
train_data.drop(['Cabin', 'Ticket','PassengerId','Name','Embarked'], axis = 1, inplace = True)
train_data.dropna(axis = 0, inplace = True)
train_data.isnull().sum()
train_data
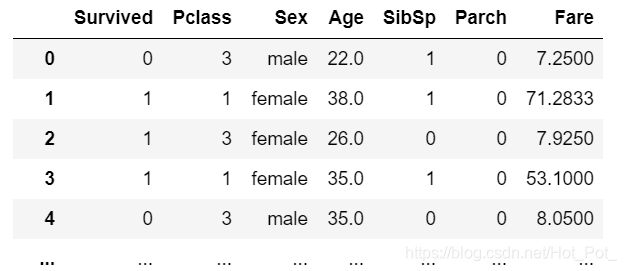
此代码块查看缺失值,由于Cabin列缺失值过多并且船舱号对是否生存没有影响(Pclass列已经把舱的等级信息包含在内),所以对其丢弃(ticket列虽然没有缺失值,但是出于相同理由将其丢弃)。
age列也有缺失值但是不是很多,而且age对生存率一定有影响,所以将这列保留,对缺失值行删除。
2.描述性数据可视化
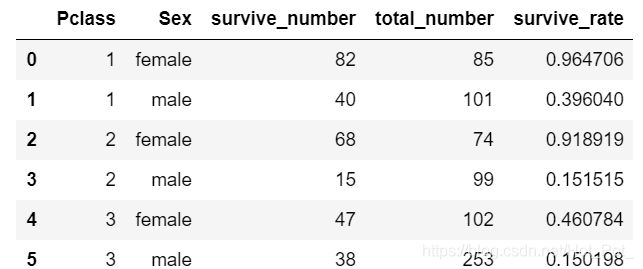
分析各个舱位不同性别的生还比率
p_s = pd.DataFrame(train_data[['Pclass', 'Sex', 'Survived']].groupby(['Pclass', 'Sex']).sum())
p_s.rename(columns={
     'Survived':'survive_number'}, inplace = True)
p_s.reset_index(level=None, drop=False, inplace=True)
p_s['total_number'] = list(train_data[['Pclass', 'Sex', 'Survived']].groupby(['Pclass', 'Sex']).size())
p_s['survive_rate'] = p_s['survive_number'] / p_s['total_number']
为了更直白的看出来各个生存率之间的比较,用生存率做一个条形图出来。
plt.figure(figsize=(6, 8))
sns.barplot(x = "Pclass", y = "survive_rate", hue="Sex", data=p_s,
            hue_order = ["male", "female"])
plt.title("Survival_rate", fontsize=16)
plt.xlabel("Pclass", fontsize=16)
plt.ylabel("Rate [%]", fontsize=16)
plt.legend(loc="upper right")
plt.show()
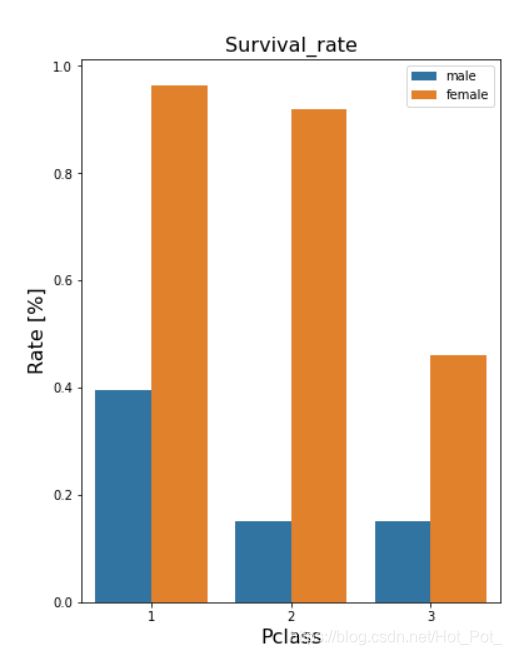
由此可以看出,不论是哪个舱位,女性的生还率都远大于男性,舱位的生还率依次递减,但是第三舱位男性生还率略高于第二仓位。
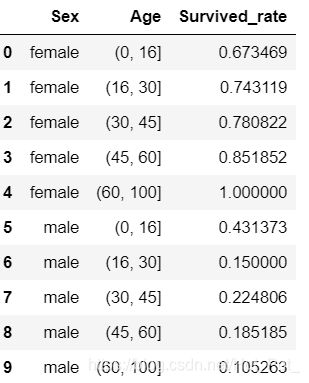
描述各个年龄段不同性别的生存率
a_s = train_data[['Age', 'Sex', 'Survived']]
ages = a_s['Age']
bins = [0, 16, 30, 45, 60, 100]
a_s['Age'] = pd.cut(ages, bins)
pd.value_counts(cats)
rate = pd.DataFrame(a_s[a_s['Survived']==1].groupby(['Sex', 'Age']).size() / a_s.groupby(['Sex', 'Age']).size())
rate.reset_index(level=None, drop=False, inplace=True)
rate.rename(columns={
     0:'Survived_rate'},inplace = True)
rate
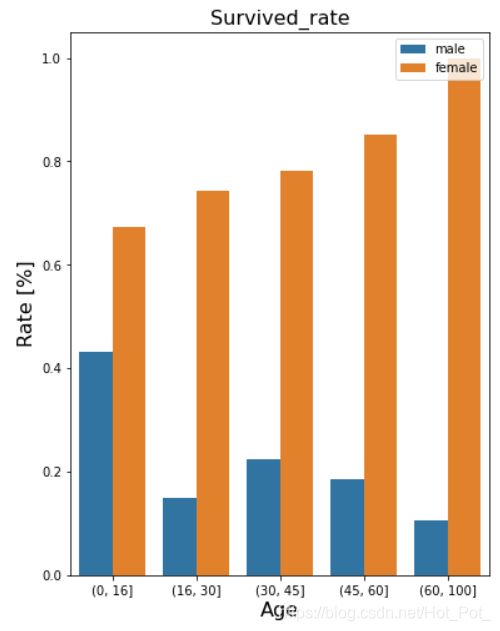
在此可以看出男性生存率随着年龄增长大致递减
而女性却一反常态,随着年龄升高,生存率却是递增。
(没有注意图中的legend放错位置了)
3.随机森林模型分析
1.进行最简单的随机森林模型测试
y = train_data['Survived']
x = train_data.drop('Survived', axis = 1)
xtrain,xtest,ytrain,ytest = train_test_split(x,y,test_size = 0.3,random_state = 5)
rfc = RandomForestClassifier()   #实例化
rfc = rfc.fit(xtrain,ytrain)     #训练模型
result = rfc.score(xtest,ytest)   #计算模型准确率
result
**out**  :0.8
2.各个特征的重要性
此部分为分析所有特征的重要性排序
importances = rfc.feature_importances_
std = np.std([tree.feature_importances_ for tree in rfc.estimators_], axis=0)
indices = np.argsort(importances)[::-1]# Print the feature ranking
print("Feature ranking:")
for f in range(min(20,xtrain.shape[1])):
    print("%2d) %-*s %f" % (f + 1, 30, xtrain.columns[indices[f]], importances[indices[f]]))# Plot the feature importances of the forest
plt.figure()
plt.title("Feature importances")
plt.bar(range(xtrain.shape[1]), importances[indices],  color="r", yerr=std[indices], align="center")
plt.xticks(range(xtrain.shape[1]), indices)
plt.xlim([-1, xtrain.shape[1]])
plt.show()
3.和决策树进行对比
和决策树的得分进行对比,选出较好的模型
```python
clf = DecisionTreeClassifier(max_depth=None, min_samples_split=2,random_state=0)
scores = cross_val_score(clf, xtrain, ytrain)
print(scores.mean())

clf2 = RandomForestClassifier(n_estimators=10, max_depth=None,min_samples_split=2, random_state=0)
scores = cross_val_score(clf2, xtrain, ytrain)
print(scores.mean())

OUT:0.7354343434343434
    0.7954949494949495
很明显随机森林模型是要比决策树模型更好一点。
4.对超参数进行调优
首先对分类器进行调优
param_test1 = {
     'n_estimators': range(25,500,25)}
gsearch1 = GridSearchCV(estimator = RandomForestClassifier(min_samples_split=100,
                                                           min_samples_leaf=20,
                                                           max_depth=8, random_state=10),
                        param_grid = param_test1,
                        scoring='roc_auc',
                        cv=5)
gsearch1.fit(xtrain, ytrain)
print(gsearch1.best_params_, gsearch1.best_score_)
OUT:{
     'n_estimators': 200} 0.8589065016892132
剩余的不再一一赘述,直接展示结果。
{‘min_samples_leaf’: 10, ‘min_samples_split’: 100} 0.8611709027668886
{‘max_depth’: 5} 0.8612550070562073
{‘class_weight’: None, ‘criterion’: ‘gini’} 0.8612550070562073
最后对模型进行评估:
roc_auc_score(ytest, gsearch4.best_estimator_.predict_proba(xtest)[:,1])
OUT:0.8247058823529413
模型的得分显著提升。
